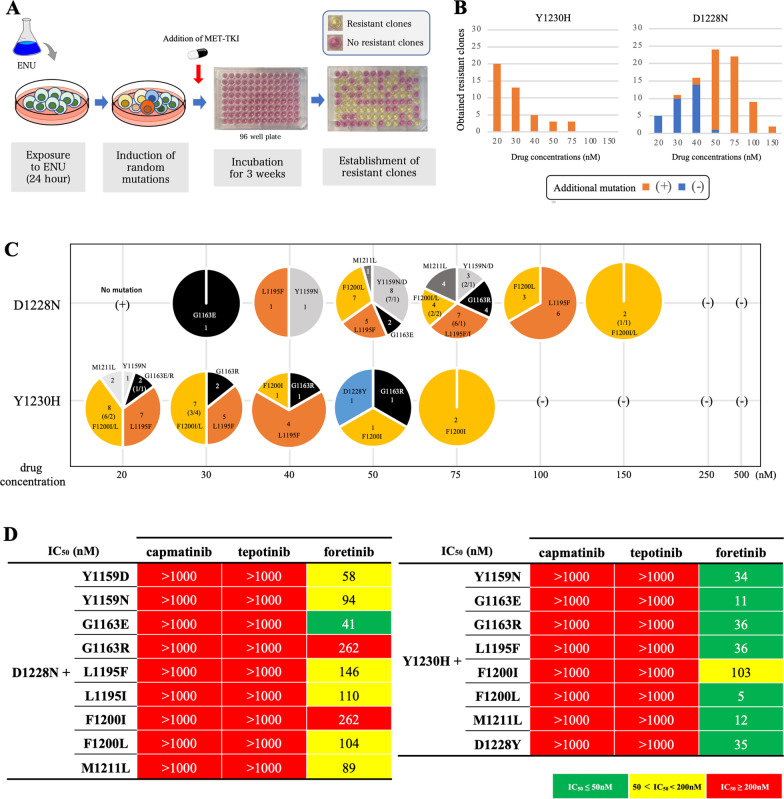
Fig. 5.
Analysis of the tertiary resistance mutations against second-line foretinib. A Schematic showing ENU mutagenesis. B The number of obtained resistant clones and the percentage of clones that carried tertiary mutations are shown for each drug concentration. Those with a tertiary mutation are shown in orange, and those without are shown in blue. C The detailed tertiary mutations obtained from ENU mutagenesis screening with foretinib are summarized for each drug concentration. D The MTT assay was performed with the obtained resistant clones with a tertiary resistant mutation, and IC50 values were determined. IC50 values are classified based on the indicated colors. They were also evaluated for the presence of cross-resistance to capmatinib and tepotinib. Growth inhibitory curves are summarized in Additional file 2: Fig. S7

