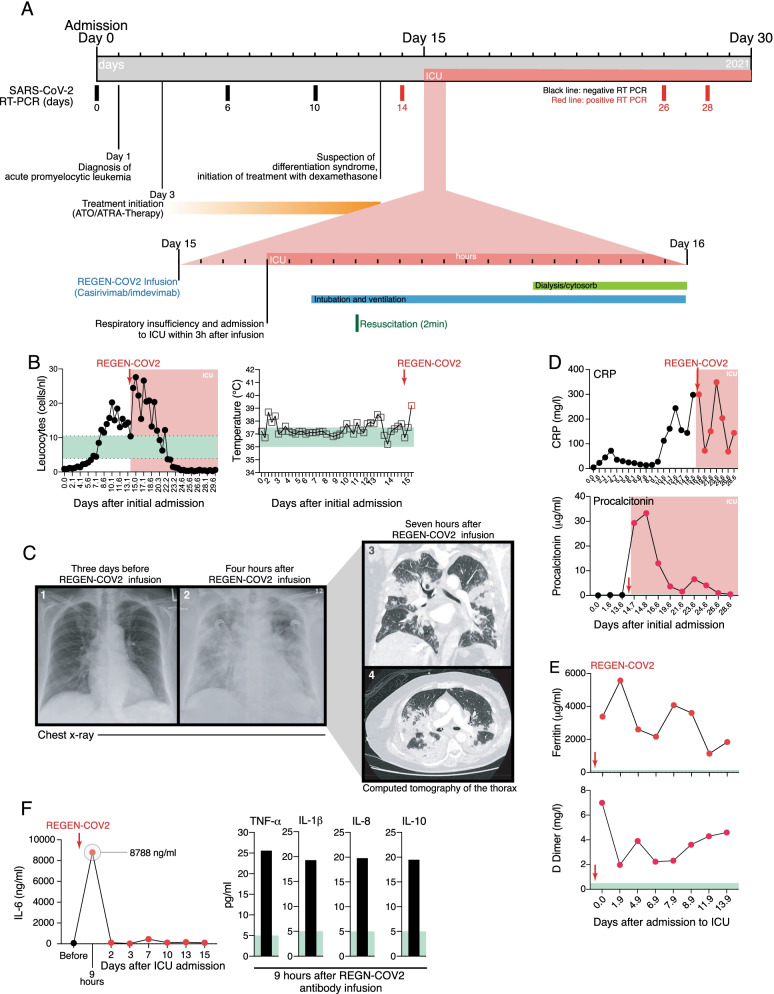
Fig. 1.
Clinical course, laboratory and radiological findings. (A) Clinical timeline from diagnosis of acute promyelocytic leukemia (APL) to CRS after casirivimab/imdevimab treatment. Diagram includes initiated treatments, SARS-CoV-2 PCR results and ICU admission and subsequent treatments. (B) Leucocyte count and body temperature. (C) Chest radiographs and subsequent CT scan of the chest. (D) CRP and procalcitonin during the course of admission. Red dots represent measurements after casirivimab/imdevimab and ICU admission. (E) Ferritin and D-Dimer levels after casirivimab/imdevimab treatment. Red arrow (REGEN-COV2) indicates the infusion of casirivimab/imdevimab. (F) Serum IL-6, TNF-α, IL-1β, IL-8 and IL-10 levels before and after casirivimab/imdevimab treatment. Red dots represent measurements after casirivimab/imdevimab infusion and ICU admission. Normal ranges are highlighted in green

