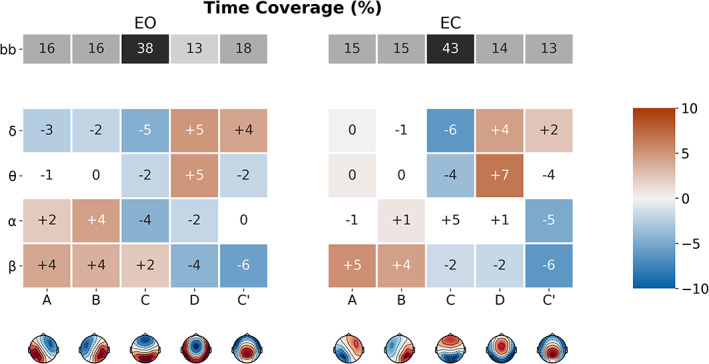
FIGURE 5.

Microstate (MS) map differences in time coverage (TimeCov) between broadband and narrowband filtered electroencephalography (EEG), for eyes‐open (EO) and eyes‐closed (EC) conditions. The first row (in grey) represents the mean TimeCov of the broadband segmentation. Coloured rows represent the mean TimeCov difference between the narrowband (δ, ϴ, α and β) and broadband segmentations, for each MS (A–C′). Significant differences have red/blue backgrounds, while non‐significant ones have a white/grey background
