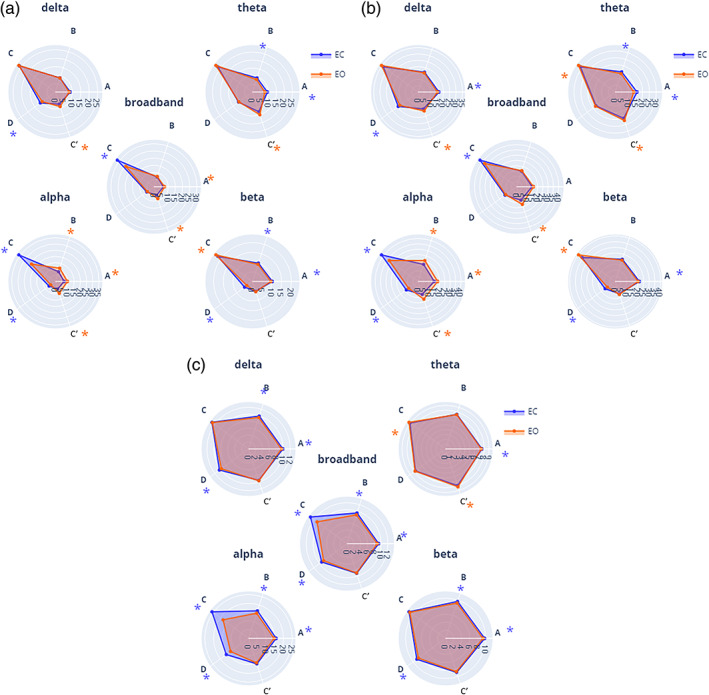
FIGURE 7.

EO versus EC comparison using frequency‐specific microstate (MS) parameters. (a) Mean global explained variance (GEV, %), and (b) mean time coverage (time coverage, %) for each MS (A–C′) within each frequency band (broadband, delta, theta, alpha and beta) for both eyes‐closed condition (EC, blue) and eyes‐open condition (EO, red). Significance values are indicated from paired permutation test on mean between conditions: no asterisk: .05 > p, *p < .05, *colour indicates the condition with highest value
