FIGURE 8.

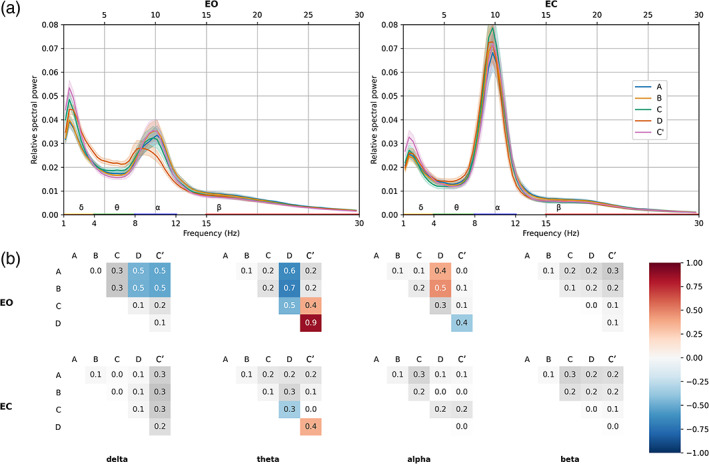
(a) Electroencephalography (EEG) relative power spectral densities of microstate (MS) time courses in EO and EC conditions. Solid lines represent mean value across subjects (n = 203); shaded areas represent 95% confidence intervals. Traditional frequency bands: delta (orange, 1–4 Hz), theta (green, 4–8 Hz), alpha (blue, 8–12 Hz) and beta (red, 15–30 Hz) are highlighted on the x‐axis. (b) Differences of effect size (Cohen's d) between the relative spectral powers of each spatially filtered MS time course, within each frequency band. Positive/negative differences represent the column–row variable subtraction. Bonferroni‐corrected significant differences have red/blue backgrounds, while non‐significant ones have a white/grey background
