
FIGURE 1.
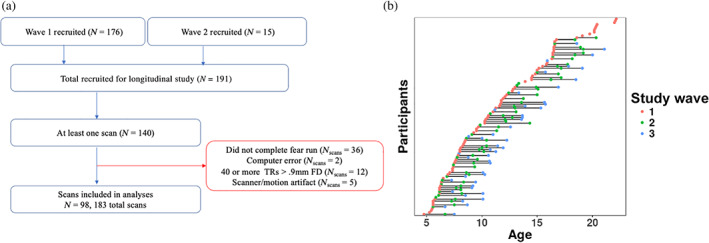
(a) Schematic showing study inclusion criteria. (b) Included scans at each study wave, with each dot representing one scan, and horizontal lines connecting participants across study waves
Official websites use .gov
A
.gov website belongs to an official
government organization in the United States.
Secure .gov websites use HTTPS
A lock (
) or https:// means you've safely
connected to the .gov website. Share sensitive
information only on official, secure websites.
(a) Schematic showing study inclusion criteria. (b) Included scans at each study wave, with each dot representing one scan, and horizontal lines connecting participants across study waves