
FIGURE 2.
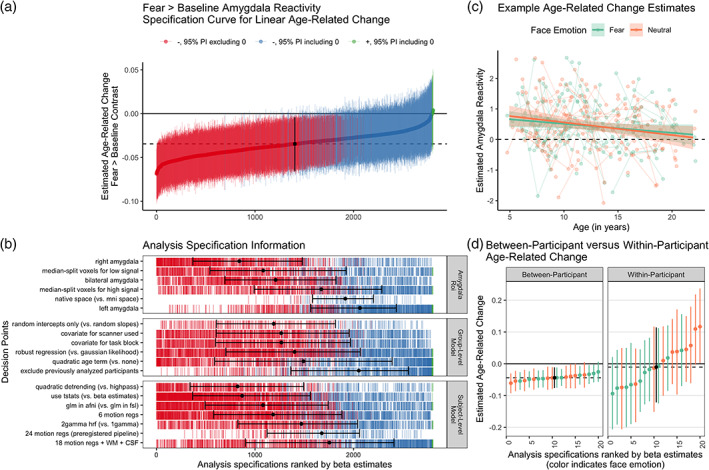
Multiverse analyses of age‐related change in amygdala reactivity. (a). Specification curve of age‐related change in fear > baseline amygdala reactivity. Points represent estimated linear age‐related change and lines are corresponding 95% posterior intervals (PIs). Models are ordered by age‐related change estimates, with the dotted line representing the median estimate across all specifications. Color indicates sign of beta estimates and whether respective posterior intervals include 0 (red = negative excluding 0; blue = negative including 0, green = positive including 0, black = median across all specifications). (b). Model specification information corresponding to each model in A. Variables on the y‐axis represent analysis choices, corresponding color‐coded marks indicate that a choice was made, and blank space indicates that the choice was not made in a given analysis. Within each category panel (amygdala ROI, Group‐Level Model, and Participant‐Level Model), decision points are ordered from top to bottom by the median model rank when the corresponding choice is made (i.e., choices at the top of each panel tend to have more negative age‐related change estimates). Black points with error bars represent the median and IQR ranks of specifications making the choice indicated on the corresponding line. (c). Example participant‐level data and model predictions for age‐related related change in amygdala reactivity for both the fear > baseline (green) and neutral‐baseline (orange) contrasts. Data are shown for a preregistered pipeline using a native space bilateral amygdala mask, 24 motion regressors, t‐statistics, high‐pass filtering, and participant‐level GLMs in FSL. Points represent participant‐level estimates, light lines connect estimates from participants with multiple study visits, and dark lines with shaded area represent model predictions and 95% posterior intervals. (d). Specification curves for a subset of models separately parametrizing within‐participant (right) vs. between‐participant (left) age‐related change for both the fear > baseline (green) and neutral > baseline (orange) contrasts, as well as the median across specifications (black). See https://pbloom.shinyapps.io/amygdala_mpfc_multiverse/ for interactive visualizations