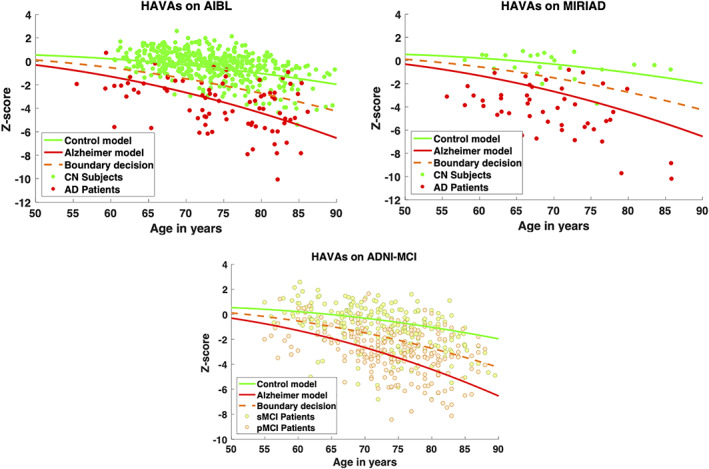
FIGURE 3.

HAVAs classification results on three external testing datasets (ADNI was the training dataset). The CN trajectory is in green, the AD trajectory in red and the boundary decision in orange. For AIBL and MIRIAD datasets, CN subjects are in green and AD patients in red. For ADNI dataset, sMCI patients are in yellow and the pMCI patients in orange
