
FIGURE 1.
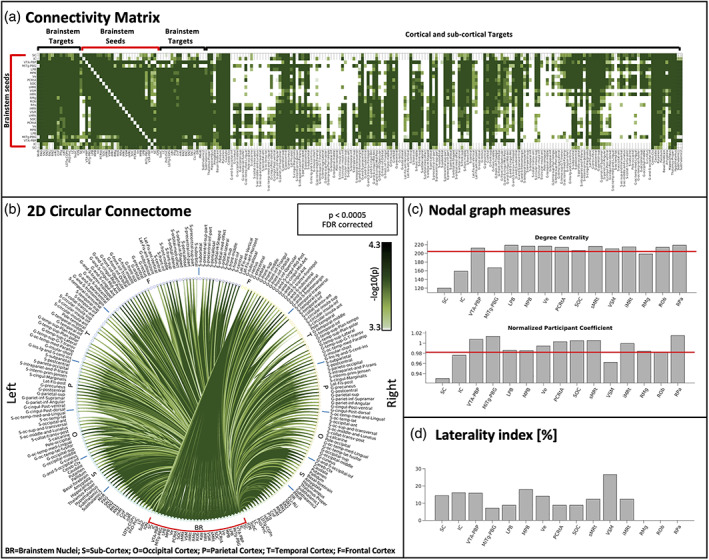
Connectivity matrix, 2D circular connectome, nodal graph measures and laterality index of all autonomic, pain, limbic and sensory brainstem nuclei. (a) The 2D connectivity matrix, (b) the region‐based 2D structural connectome at the group level of the autonomic, pain, limbic, and sensory brainstem nuclei (for both a and b we used a p < .0005 false discovery rate (FDR) corrected threshold and display the (−log10(p value)). (c) We display nodal graph measures (such as degree centrality and normalized participant coefficient) and (d) the laterality index. List of abbreviations of 15 brainstem nuclei used as seeds (marked with red brackets in a and b): superior colliculus (SC), inferior colliculus (IC), ventral tegmental area‐parabrachial pigmented nucleus (VTA‐PBP), microcellular tegmental nucleus–parabigeminal nucleus (MiTg‐PBG), lateral parabrachial nucleus (LPB), medial parabrachial nucleus (MPB), vestibular nuclei complex (Ve), parvicellular reticular nucleus‐alpha part (PCRtA), superior olivary complex (SOC), superior medullary reticular formation (sMRt), viscerosensory motor nuclei complex (VSM), inferior medullary reticular formation (iMRt), raphe magnus (RMg), raphe obscurus (ROb) and raphe pallidus (RPa). List of abbreviations of 18 additional brainstem nuclei used as targets: median raphe nucleus (MnR), periaqueductal gray (PAG), substantia nigra‐subregion1 (SN1), substantia nigra‐subregion2 (SN2), red nucleus‐subregion1 (RN1), red nucleus‐subregion2 (RN2), mesencephalic reticular formation (mRt), cuneiform nucleus (CnF), pedunculotegmental nucleus (PTg), isthmic reticular formation (isRt), laterodorsal tegmental nucleus–central gray of the rhombencephalon (LDTg‐CGPn), pontine reticular nucleus, oral part–pontine reticular nucleus, caudal part (PnO‐PnC), locus coeruleus (LC), subcoeruleus nucleus (SubC), inferior olivary nucleus (ION), caudal–rostral linear raphe (CLi‐RLi), dorsal raphe (DR), and paramedian raphe nucleus (PMnR)