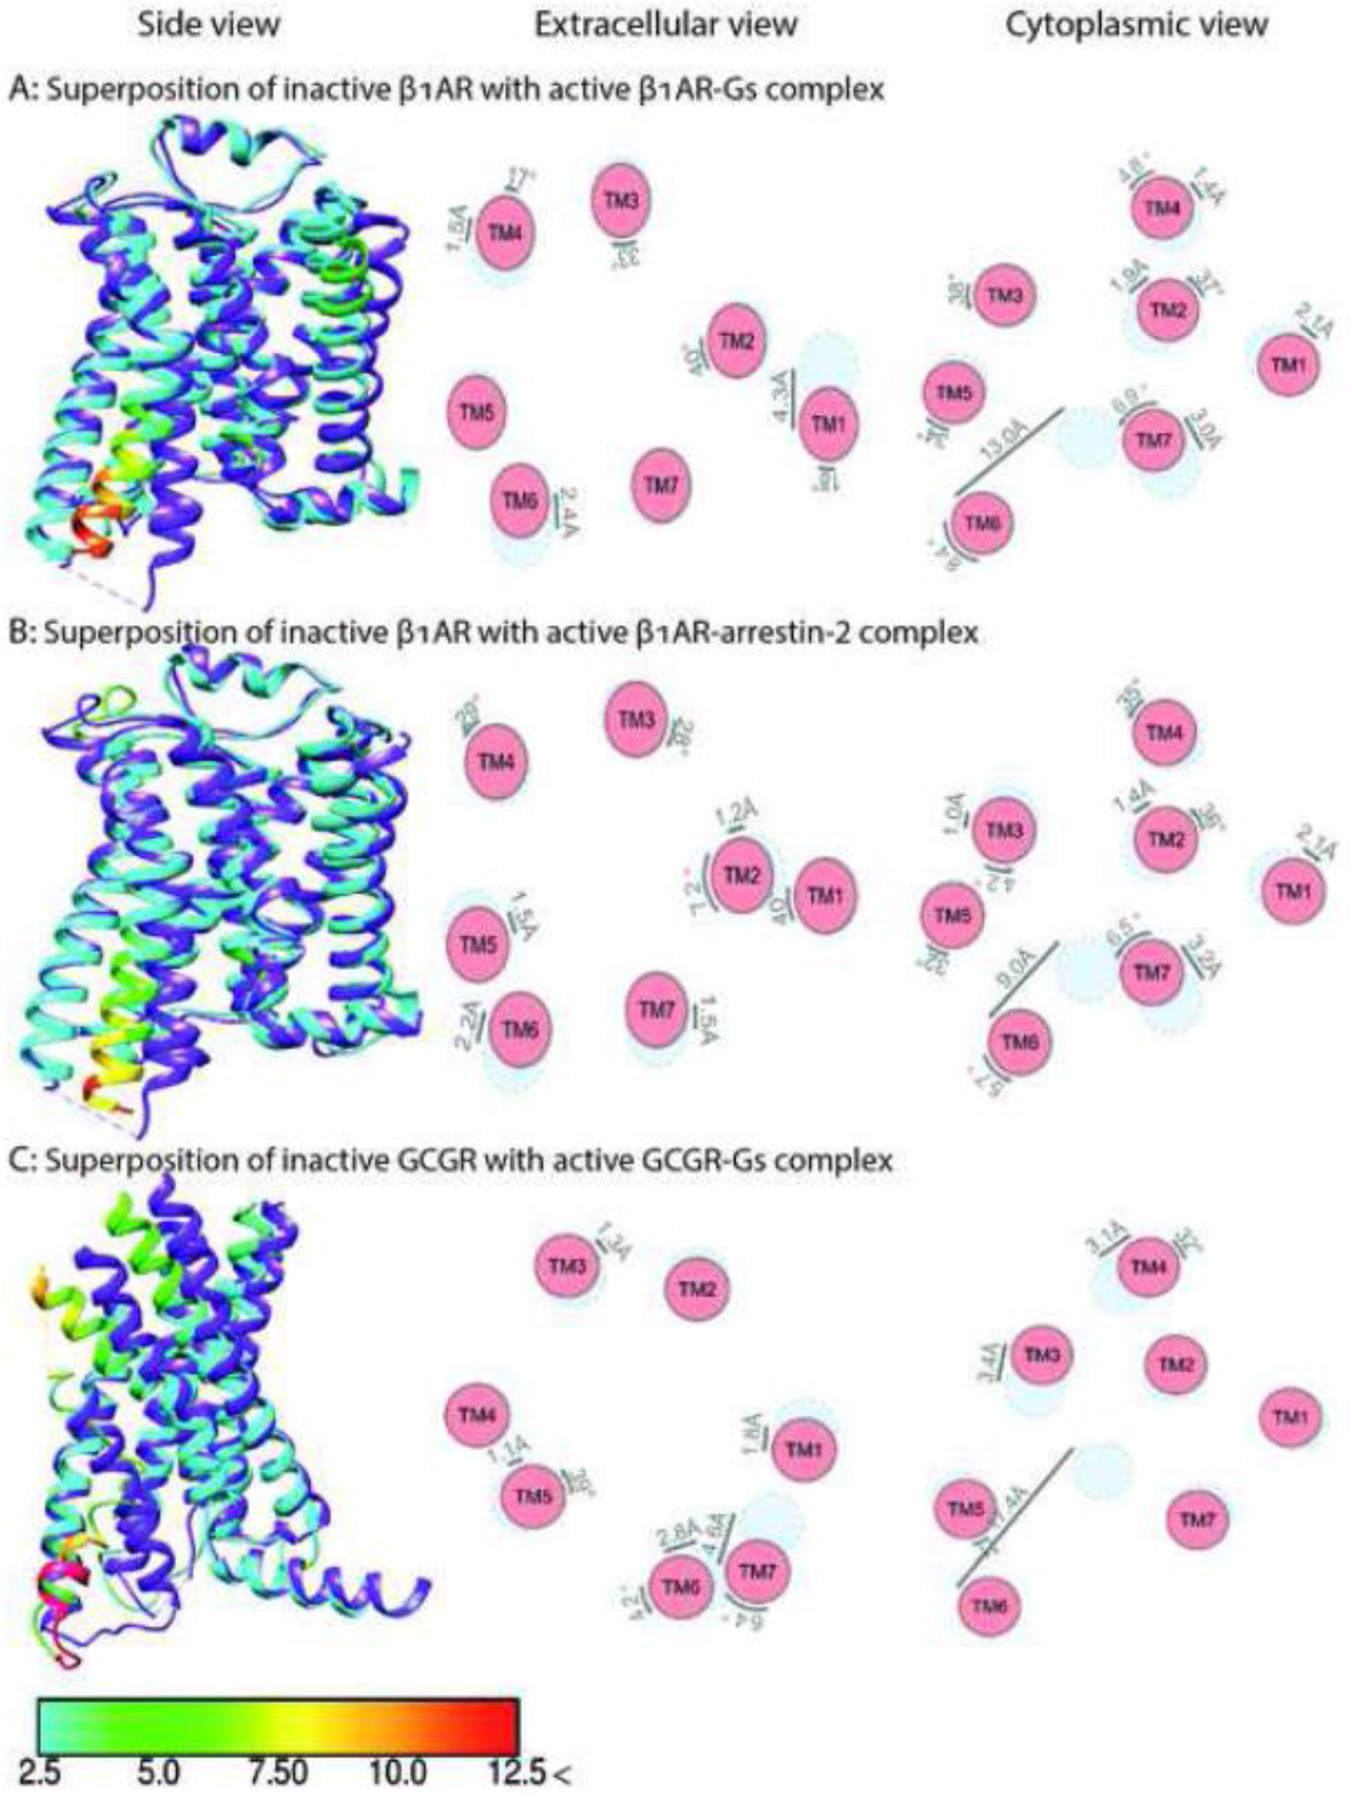
Fig. 3. Comparison of the structures of class A adrenergic β1AR and class B Glucagon GCGR in complex with Gs or arrestin-2.

The structure of inactive β1AR (PDB: 4GPO) [87] is superposed with activated β1AR in complex with Gs (panel A, PDB: 7JJO) [47] and arrestin-2 (panel B, PDB: 6TKO) [54]. The structure of inactive GCGR (PDB:5YQZ) [87] is superposed with activated GCGR in complex with Gs (panel C, PDB:6LMK) [42]. Shown are side views (left panel), and schematic representation of helices from extracellular (middle panels) and cytoplasmic views (right panel). The positions of helices in the inactive state are shown in light blue, active in red. Inactive receptors in left panels are colored purple. The residues of the active receptors in complex with intracellular partners are color coded based on the RMSD of α-carbons from the matched residues in the inactive receptor with thresholds of 2.5 Å (cyan), 5 Å (green), 7.5 Å (yellow), 10 Å (orange), and 12.5 Å (red). The direction and extent of displacement of helices are also indicated by arrows.
