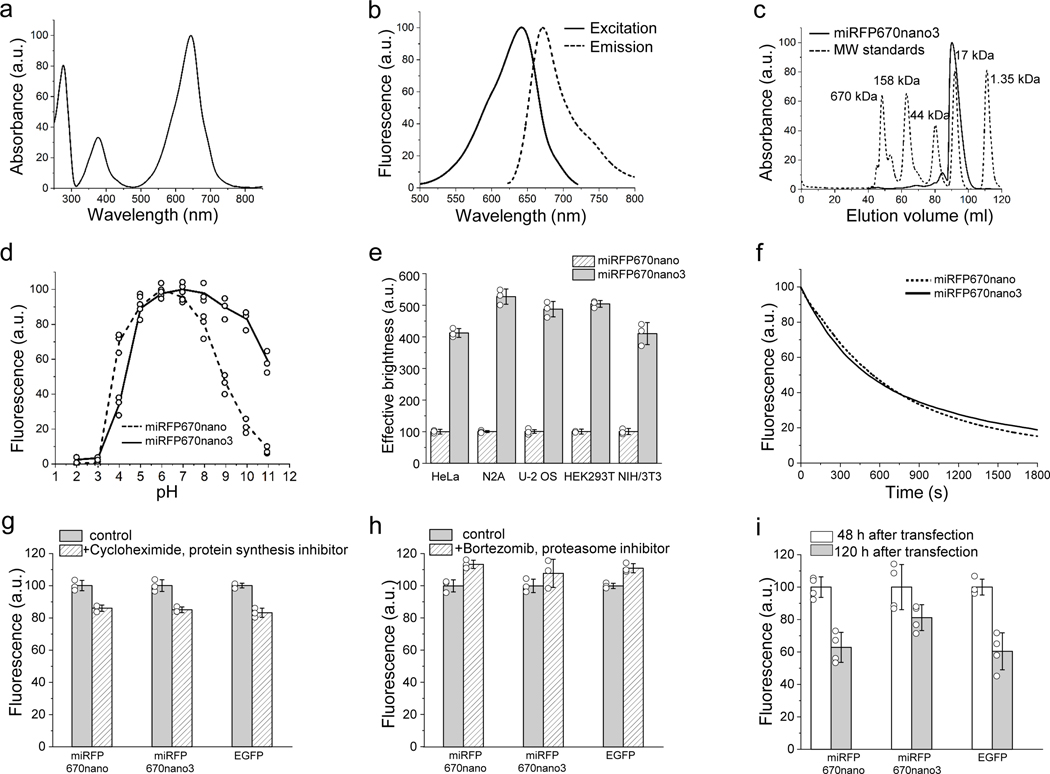
Figure 1. Characterization of miRFP670nano3 protein.
(a) Absorbance spectra. (b) Fluorescence excitation spectrum recorded at 730 nm emission and emission spectrum recorded at 600 nm excitation. (c) Size exclusion chromatography of miRFP670nano3 and used molecular weight protein standards. (d) pH dependence of miRFP670nano3 fluorescence in comparison with parental miRFP670nano. (e) Effective (cellular) brightness of miRFP670nano3 and miRFP670nano in transiently transfected HeLa, N2A, U-2 OS, HEK293T, and NIH3T3 live cells. Fluorescence intensity was analyzed 72 h after transfection. The effective brightness of miRFP670nano was assumed to be 100% for each cell type. Data are presented as mean values ± s.d. for n = 3 transfection experiments. (f) Photobleaching kinetics of miRFP670nano3 in comparison with parental miRFP670nano in live HeLa cells. (g) Fluorescence intensity of live HeLa cells transiently transfected with miRFP670nano3, miRFP670nano, or EGFP before and after 4 h of incubation with 20 μg/ml cycloheximide. Data are presented as mean values ± s.d. for n = 3 transfection experiments. (h) Fluorescence intensity of live HeLa cells transiently transfected with miRFP670nano3, miRFP670nano, or EGFP before and after 4 h of incubation with 10 μM bortezomib. Data are presented as mean values ± s.d. for n = 3 transfection experiments. (i) Fluorescence intensity of live HeLa cells transiently transfected with miRFP670nano3, miRFP670nano, or EGFP 48 h and 120 h after transfection normalized to that at 48 h. Data are presented as mean values ± s.d. for n = 4 transfection experiments. Fluorescence intensity in (e, g, h, i) was measured by flow cytometry using a 640 nm excitation laser and a 670 nm LP emission filter for miRFP670nano and miRFP670nano3, and a 488 nm excitation laser and a 510/15 nm emission filter for EGFP. Gating was performed as shown in Supplementary Fig. 3.

