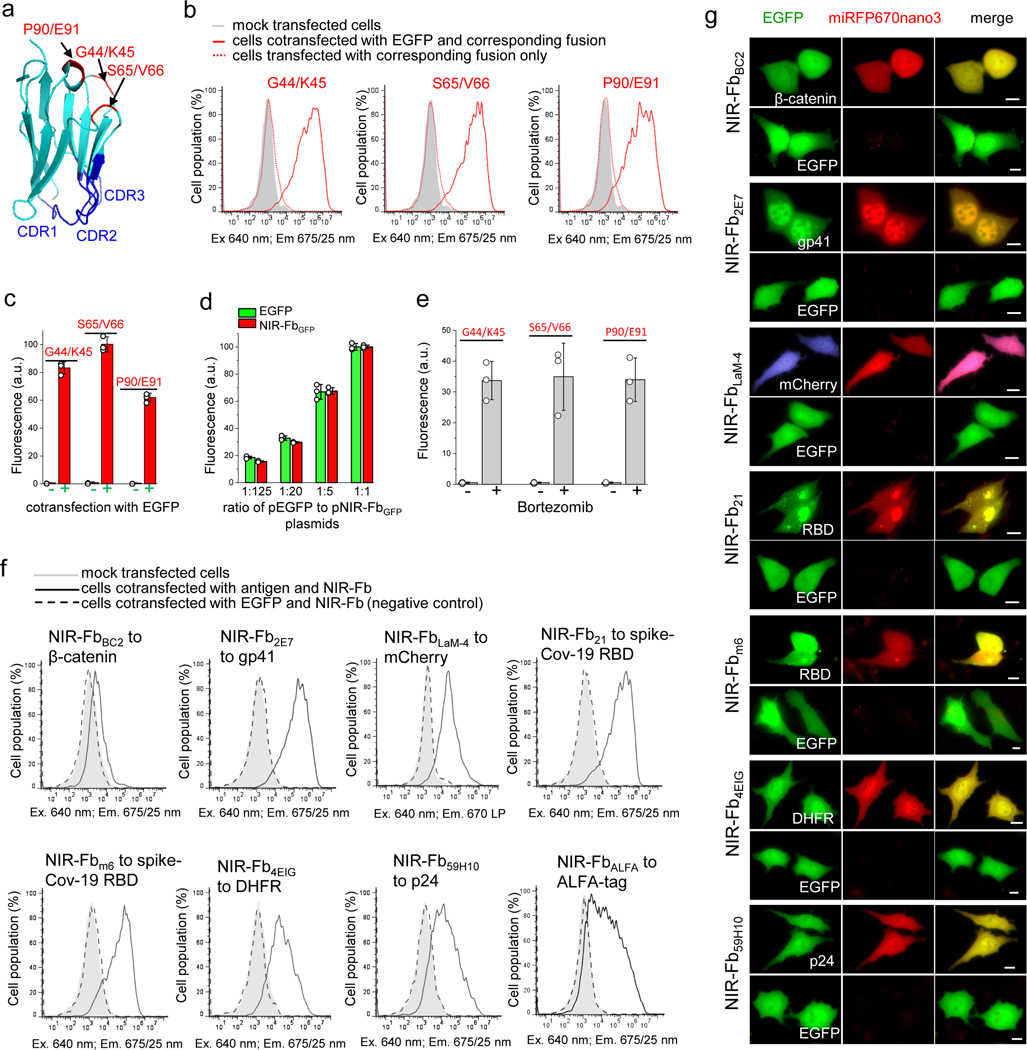
Figure 3. Design and evaluation of nanobodies (Nbs) internally fused with miRFP670nanos (NIR-Fbs) in live HeLa cells.
(a) Structure of Nb against GFP (NbGFP) (PDB ID: 3OGO) with indicated positions for insertion of miRFP670nano3. (b) The fluorescence intensity distribution of cells transfected with NbGFP, containing miRFP670nano3 inserted at G44/K45, S65/V66, or P90/E91 positions and co-expressed with or without EGFP. (c) Quantification of the data presented in (b). Data are presented as mean values ± s.d. for n = 3 transfection experiments. (d) Fluorescence intensity of cells transfected with the same amount of the pNIR-FbGFP plasmid and indicated ratios of the pEGFP-N1 plasmid to the pNIR-FbGFP plasmid. Fluorescence intensity of cells transfected with the pNIR-FbGFP and pEGFP-N1 plasmids with the ratio of 1:1 was assumed to be 100% for each FP. Data are presented as mean values ± s.d. for n = 3 transfection experiments. (e) Mean fluorescence intensity of cells transfected with NbGFP, containing miRFP670nano3 inserted at G44/K45, S65/V66 or P90/E91 sites via Gly4Ser linkers before and after 4 h of incubation with 10 μM bortezomib. Fluorescence intensity of cells co-transfected with pEGFP-N1 and NbGFP, containing miRFP670nano3 inserted at Ser65/Val66 was assumed to be 100%. Data are presented as mean values ± s.d. for n = 3 transfection experiments. (f) The fluorescence intensity distribution of cells transfected with NIR-Fbs to indicated antigens and co-expressed with or without cognate antigen. (g) Fluorescence images of cells transfected with NIR-Fbs to the indicated antigens and co-expressed with either mEGFP-labeled cognate antigens or with unfused EGFP as a control. Representative images of two experiments are shown. For imaging of miRFP670nano3 and EGFP, a 605/30 nm excitation and a 667/30 nm emission, and a 485/20 nm excitation and a 525/30 nm emission filter was used, respectively. In (b, c, d, e) fluorescence intensity was analyzed by flow cytometry using a 640 nm excitation laser and a 675/25 nm emission filter for miRFP670nano3, and a 488 nm excitation laser and a 510/15 nm emission filter for EGFP. Gating was performed as shown in Supplementary Fig. 3. In (g) scale bars, 10 μm.

