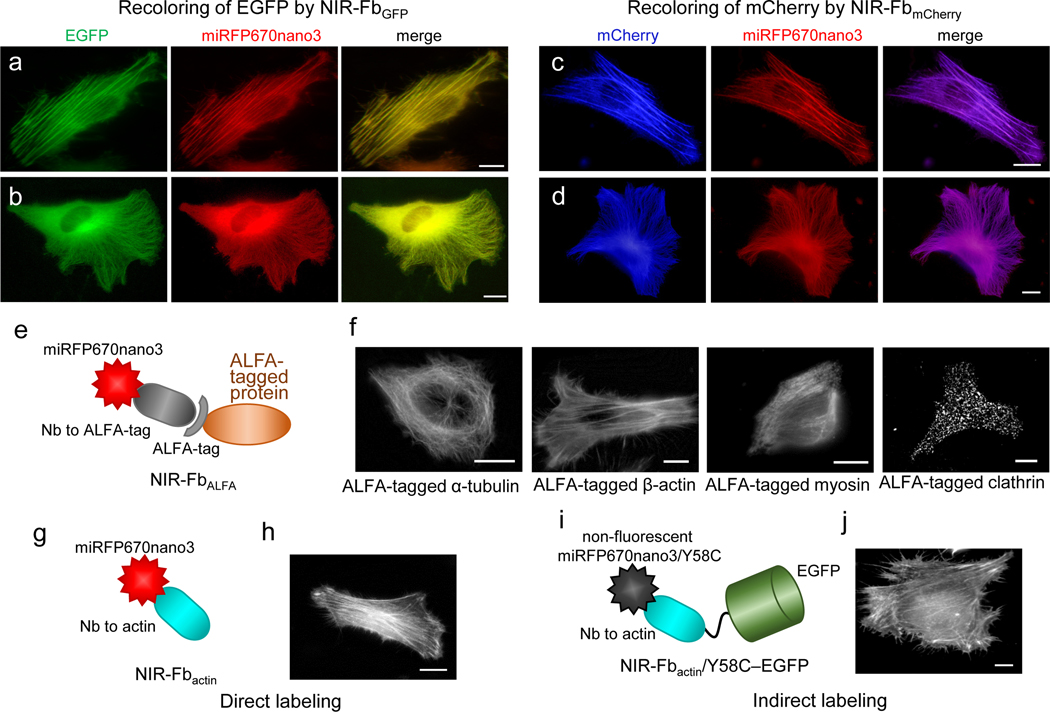
Figure 4. Labeling of intracellular proteins with NIR-Fbs in live HeLa cells.
Re-coloring of EGFP and mCherry fluorescent proteins with NIR-Fbs: (a) EGFP-β-actin labeled with NIR-FbGFP, (b) EGFP-α-tubulin labeled with NIR-FbGFP, (c) mCherry-β-actin labeled with NIR-FbmCherry, and (d) mCherry-α-tubulin labeled with NIR-FbmCherry. (e) Schematic representation of NIR-FbALFA to ALFA tag. (f) ALFA-tagged α-tubulin, β-actin, myosin, and clathrin labeled with NIR-FbALFA. (g) Schematic representation of NIR-Fbactin to β-actin. (h) Endogenous β-actin labeled with NIR-Fbactin. (i) Schematic representation of non-fluorescent NIR-Fbactin/Y58C fused with EGFP for indirect EGFP-labeling of β-actin. (j) Endogenous β-actin labeled with NIR-Fbactin/Y58C–EGFP. In (a-d, f, h, j), scale bars, 10 μm. Representative images of two experiments are shown. For imaging of miRFP670nano3, EGFP, and mCherry, a 605/30 nm excitation and a 667/30 nm emission, a 485/20 nm excitation and a 525/30 nm emission, and a 560/25 nm excitation and a 607/36 nm emission filter was used, respectively.

