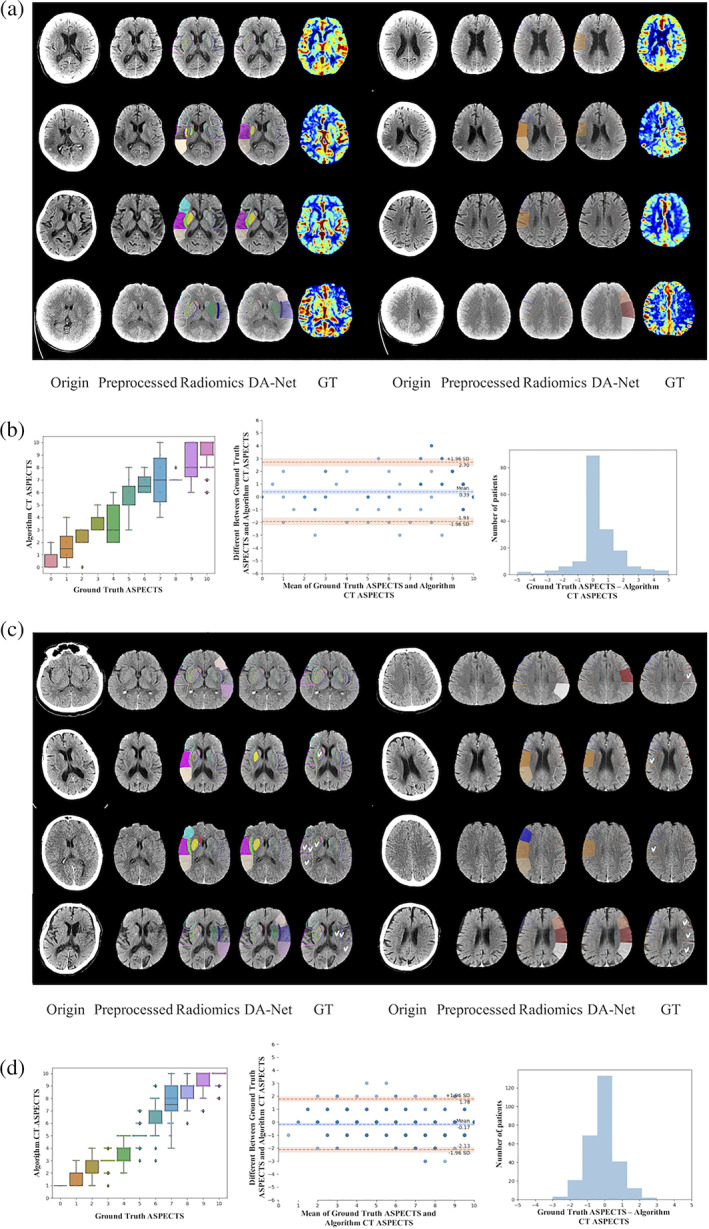
FIGURE 4.

Results of two datasets in line (a)–(d). (a and c) The visualization of four subjects from the main dataset and the independent dataset. Corresponding original CT, preprocessed CT, radiomics result, DA‐Net result (by our proposed method), and ground truth (GT) of (a) from CBF, of (c) from labeling of radiologist (J.X). For radiomics and DA‐Net results, those solid parts represented the automatically detected ischemic regions. Radiomics results without side information referred to the ground‐truth ischemic orientation for generating the visualization results. (b and d) Statistical charts using the testing set in the main dataset and independent dataset. In the left of (b) and (d) are box plots between ground‐truth and automatically‐estimated CT ASPECTS. In the middle of (b) and (d) are Bland–Altman plots. In the right of (b) and (d) are histograms of difference between ground‐truth and automatically‐estimated CT ASPECTS
