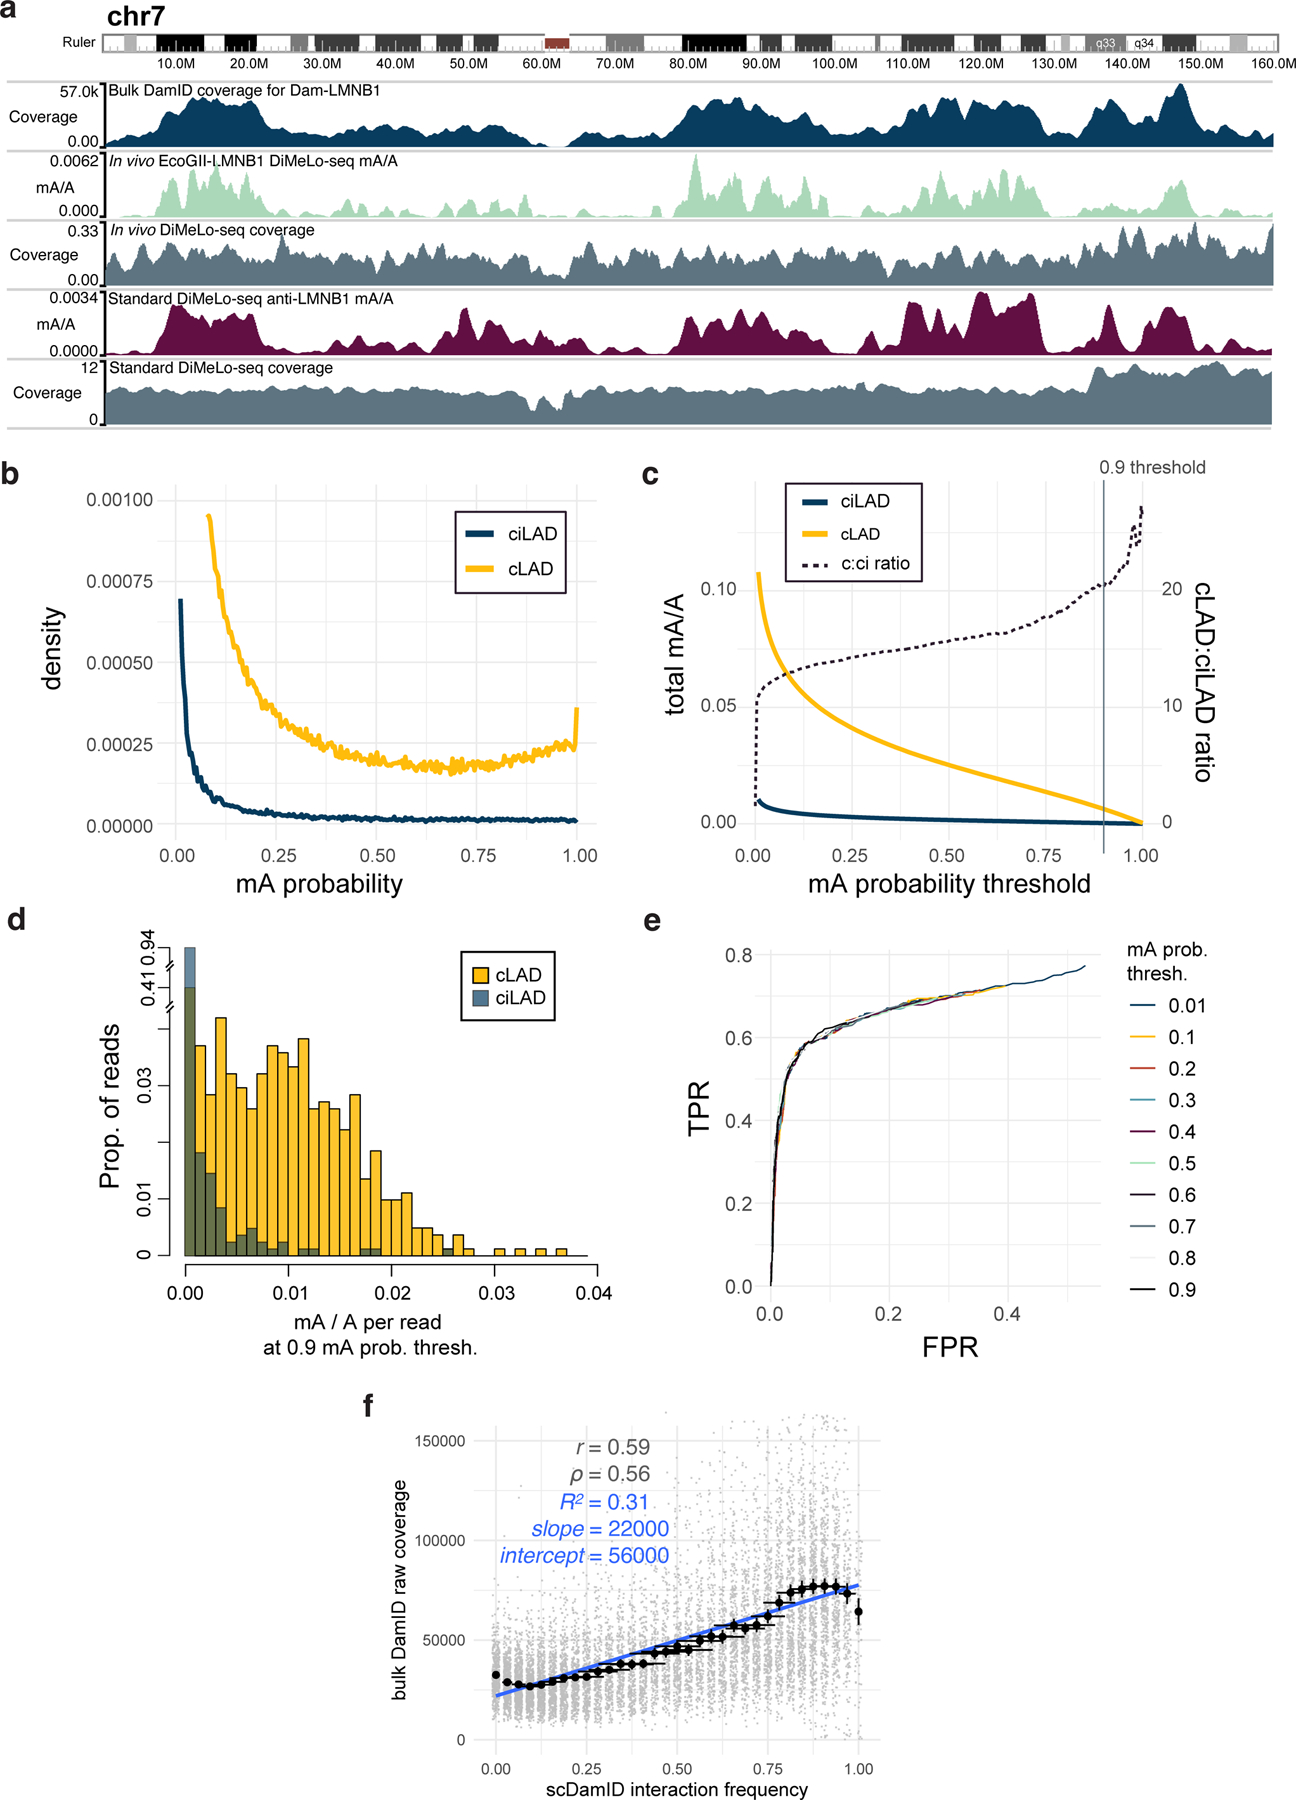
Extended Data Fig. 4. Demonstration of in vivo LMNB1-targeting and estimation of in situ sensitivity and specificity.

a, A browser view of chr7 comparing in vivo EcoGII-LMNB1 DamID (second track, green) to conventional LMNB1 in vivo DamID (first track, blue), and to LMNB1-targeted in situ DiMeLo-seq (fourth track, dark red). b, For an in situ LMNB1-targeting experiment using the final v2 protocol (#120 in Supplementary Table 1), the distributions of guppy mA probability scores across all A bases (q>10) on all reads mapping to cLADs (gold, representing on-target methylation; n = 2.8M) or ciLADs (blue, representing off-target methylation; n = 2.1M). c, As in b, but showing the cumulative distributions for all mA calls above each probability score threshold, with the ratio between these plotted as a dotted line (using the right-hand y-axis). Vertical line indicates the stringent threshold of 0.9, at which cLADs have 20 times more mA as a proportion of all As (0.6%) than do ciLADs. If the threshold is reduced to 0.5, the fraction of As called as methylated increases to 2.5% but the cLAD:ciLAD ratio decreases to 15.6. d, On a per-read basis, for all reads with at least 500 A basecalls (q>10) and using a mA probability threshold of 0.9, the distribution of mA/A called on each read for cLADs (n = 812 reads) vs. ciLADs (n = 827 reads). e, Receiver-Operator Characteristic (ROC) curve showing, for different mA calling thresholds, the ability to classify individual reads from (d) as originating from cLADs or ciLADs using a simple linear threshold on mA/A. At a false positive rate of 6%, reads can be classified with a true positive rate of 59%, and this is similar for all mA thresholds used. The total Area Under the Curve (AUC) for the p>0.9 curve is 0.78. f, As in Fig. 3e, but for bulk conventional DamID raw coverage. The y axis is truncated to omit outliers for visualization (max = 300000), but these were not omitted for linear model and correlation computation. Error bars in x represent the proportion of 32 cells +/− 2 standard errors of the proportion. Error bars in y represent the mean of n = 94 to 663 genomic bins +/− 2 standard errors of the mean.
