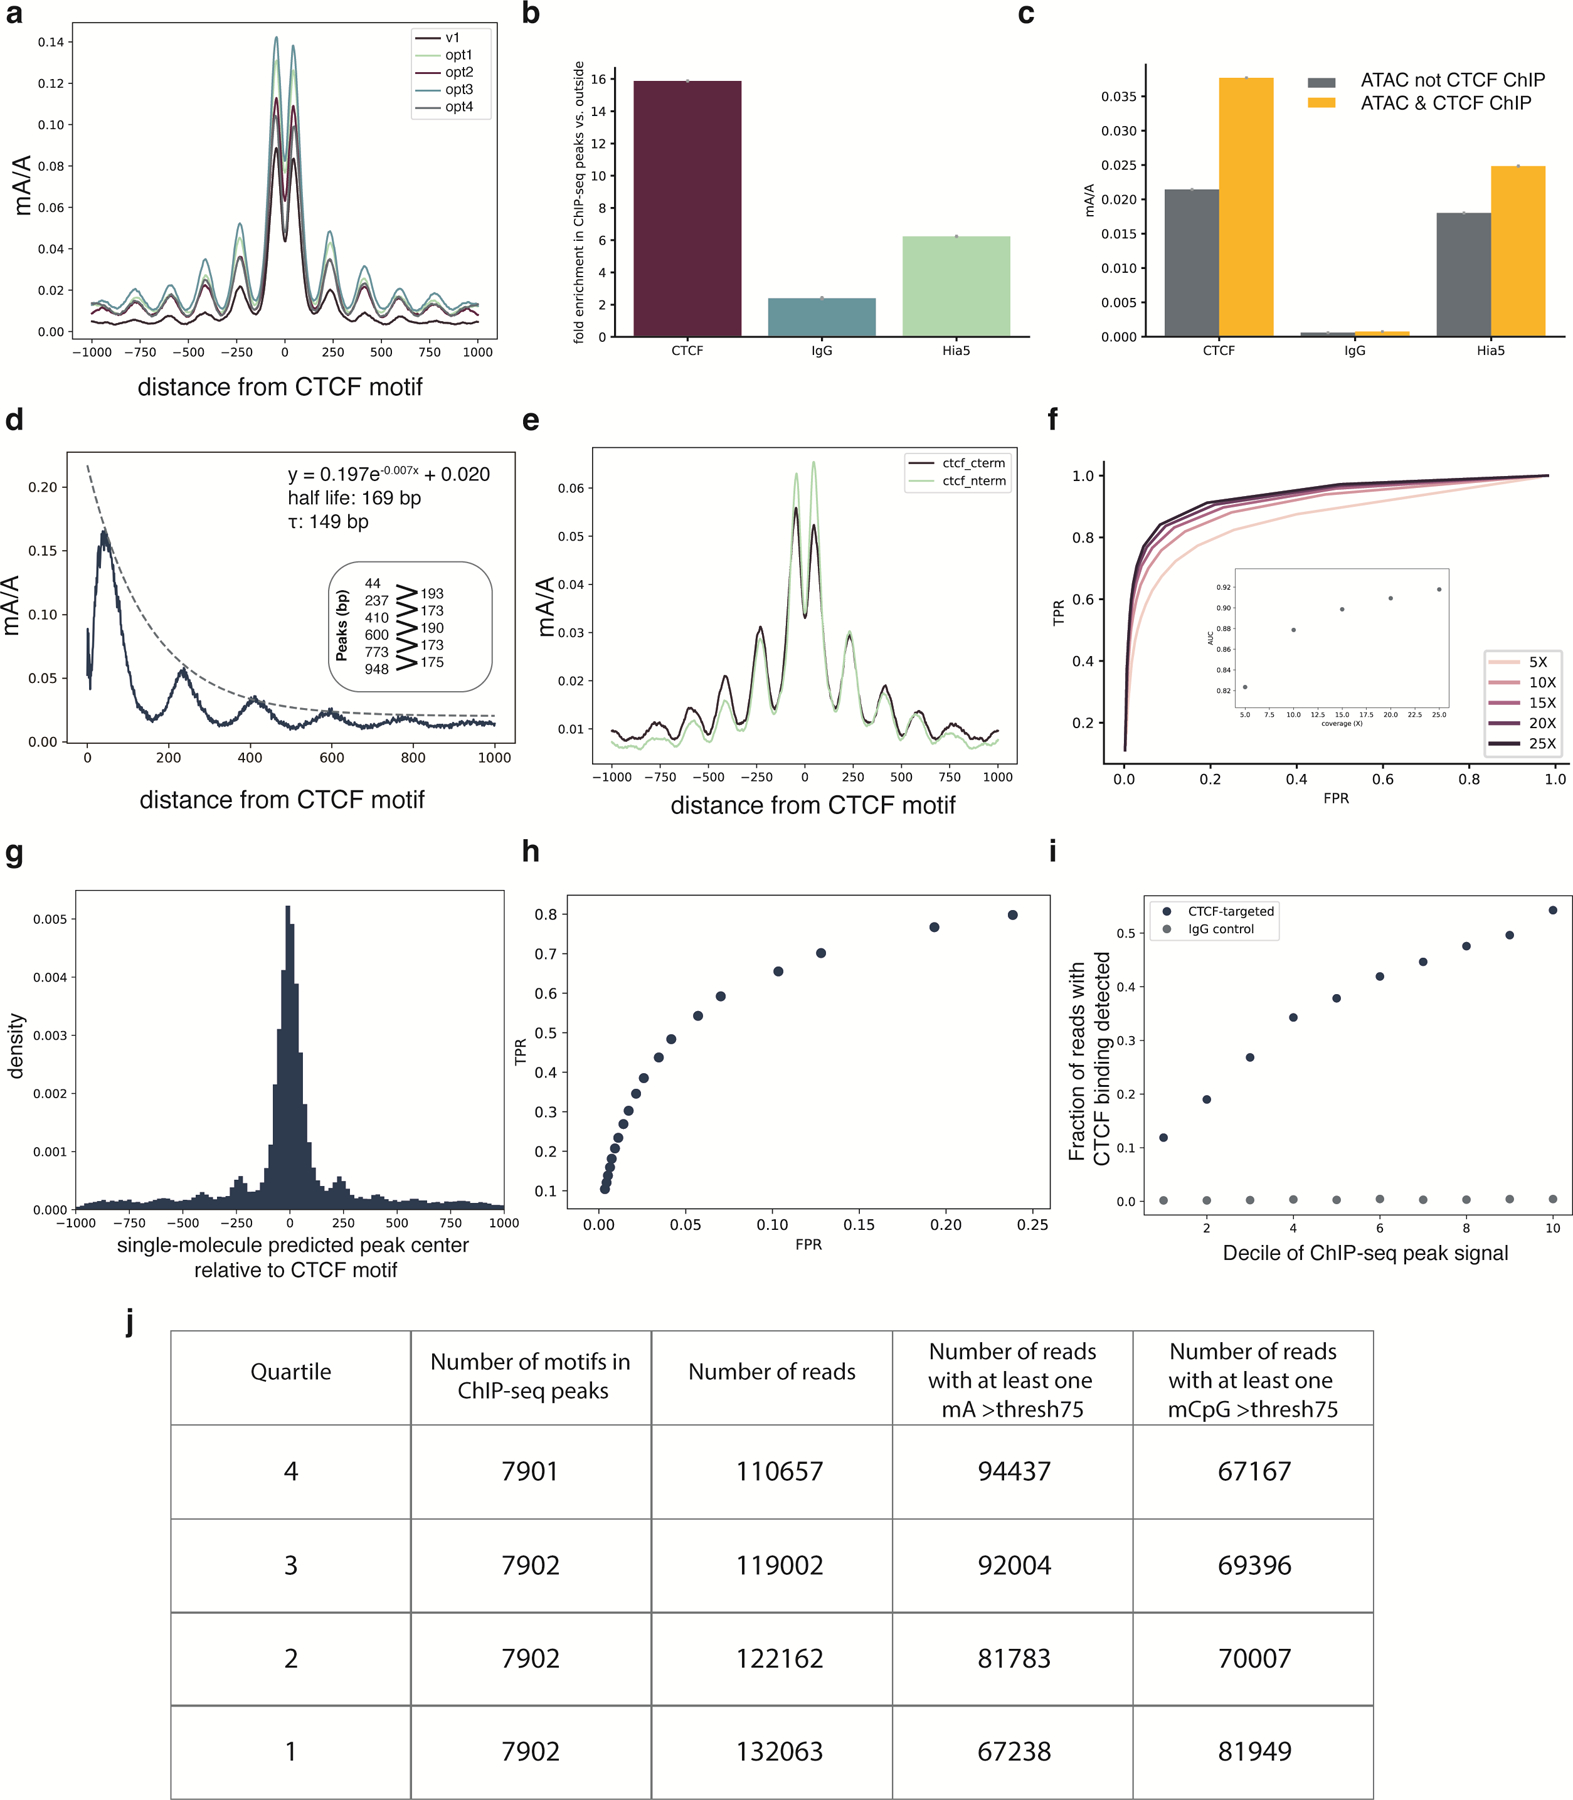
Extended Data Fig. 5. Analysis of CTCF targeting performance.

a, Enrichment profiles with mA probability threshold of 0.75 at the top quartile of ChIP-seq peaks for the DiMeLo-seq protocol v1 compared to four optimization conditions (opt1: 2 hour activation, 0.05 mM spermidine at activation, replenish SAM; opt2: 2 hour activation, 0.05 mM spermidine at activation, replenish SAM, 500 nM pA-Hia5; opt3: 2 hour activation, 0.05 mM spermidine at activation, replenish SAM, pA-Hia5 binding at 4°C for 2 hours; opt4: 2 hour activation, no spermidine, 1 mM Ca++ and 0.5 mM Mg++ buffer) (Supplementary Note 11). b, Fold enrichment over background of mA/A in ChIP-seq peak regions. Error bars represent the 95% credible interval for each ratio of proportions determined by sampling proportions from posterior beta distributions computed with uninformative priors. c, mA/A in ATAC-seq peaks that do not overlap CTCF ChIP-seq peaks (grey) and mA/A in ATAC-seq peaks that do overlap CTCF ChIP-seq peaks (yellow). Error bars are computed as in (b) d, Methylation decay from the CTCF motif center for the top decile of ChIP-seq signal is fit with an exponential decay function. The positions of the peaks are indicated, with the spacing between peaks also noted. e, Methylation profiles at top quartile of ChIP-seq peaks when targeting the C-terminus or N-terminus of CTCF. The difference between antibody binding site produces significantly different profiles (Supplementary Note 11). f, Receiver-Operator Characteristic (ROC) curves from aggregate peak calling with DiMeLo-seq targeting CTCF at 5–25X coverage using ChIP-seq as ground truth. Inset shows Area Under the Curve (AUC) as a function of coverage. g, The distribution of differences between our single-molecule predicted peak center and the known CTCF motif are plotted for single molecules within top decile ChIP-seq peaks. h, ROC curve for binary classification of CTCF-targeted DiMeLo-seq reads to identify CTCF-bound molecules based on each read’s proportion of methylated adenines in peak regions (Supplementary Note 11). At a FPR of 5.7%, a TPR of 54% is achieved. i, Fraction of reads that have a CTCF binding event detected in the peak region for each decile of ChIP-seq peak strength for the CTCF-targeted sample and IgG control. Calculated using thresholds determined from analysis in (h). Error bars do not extend beyond the points themselves so are not shown. j, Number of motifs and reads displayed in Figure 4a.
