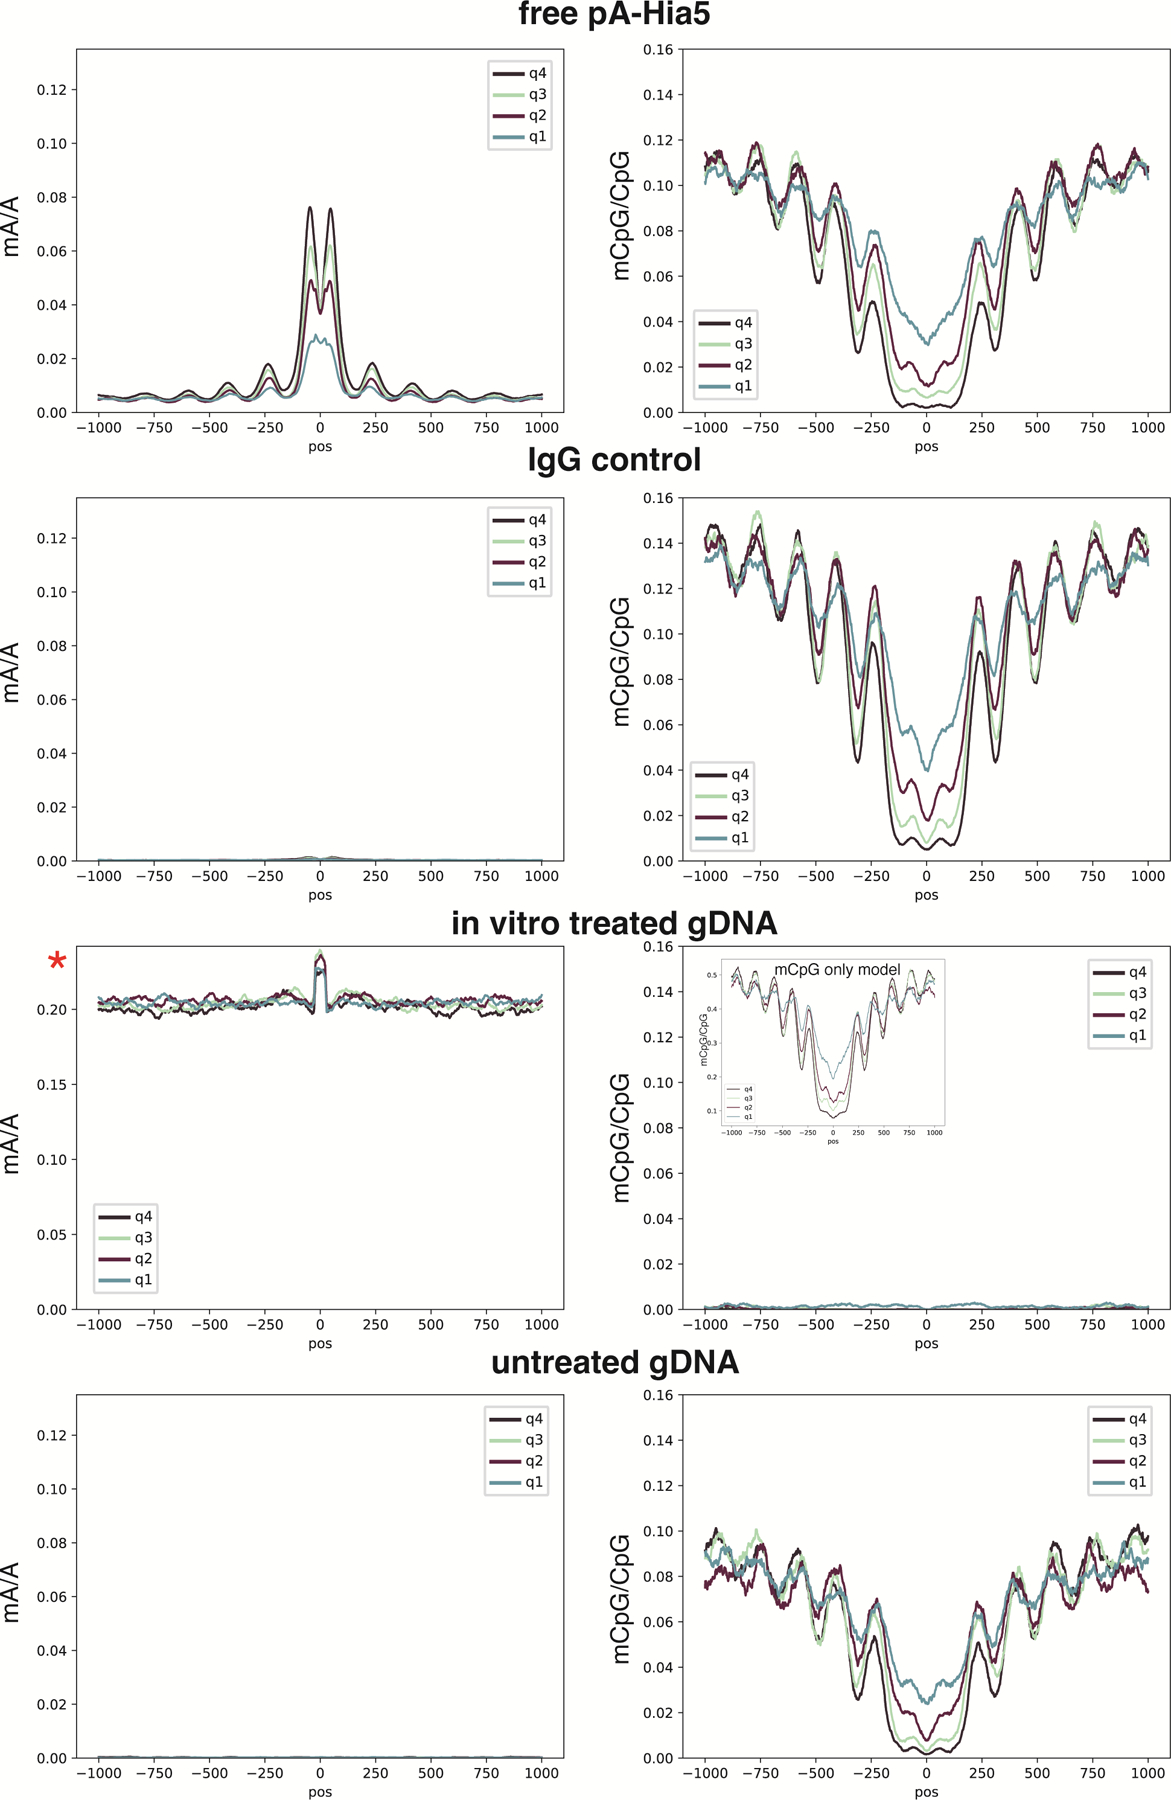
Extended Data Fig. 6. Control mA and mCpG profiles at CTCF peaks.

Profiles at CTCF ChIP-seq peaks for free pA-Hia5, IgG control, in vitro treated genomic DNA, and untreated genomic DNA. Quartiles indicate rank of ChIP-seq peak strength. All axes are the same scaling as in Figure 4a, except for mA/A of in vitro treated gDNA. With high mA levels achieved only with this in vitro methylated control, mC basecalling fails. However, if the Rerio model res_dna_r941_min_modbases_5mC_CpG_v001.cfg is used for calling mCpG separately from mA, the mCpG profile is restored, as seen in the inset for the in vitro treated gDNA sample. Importantly, as indicated by the y-axis scale in the inset, if mCpG is called separately from mA, the detected mCpG levels are higher.
