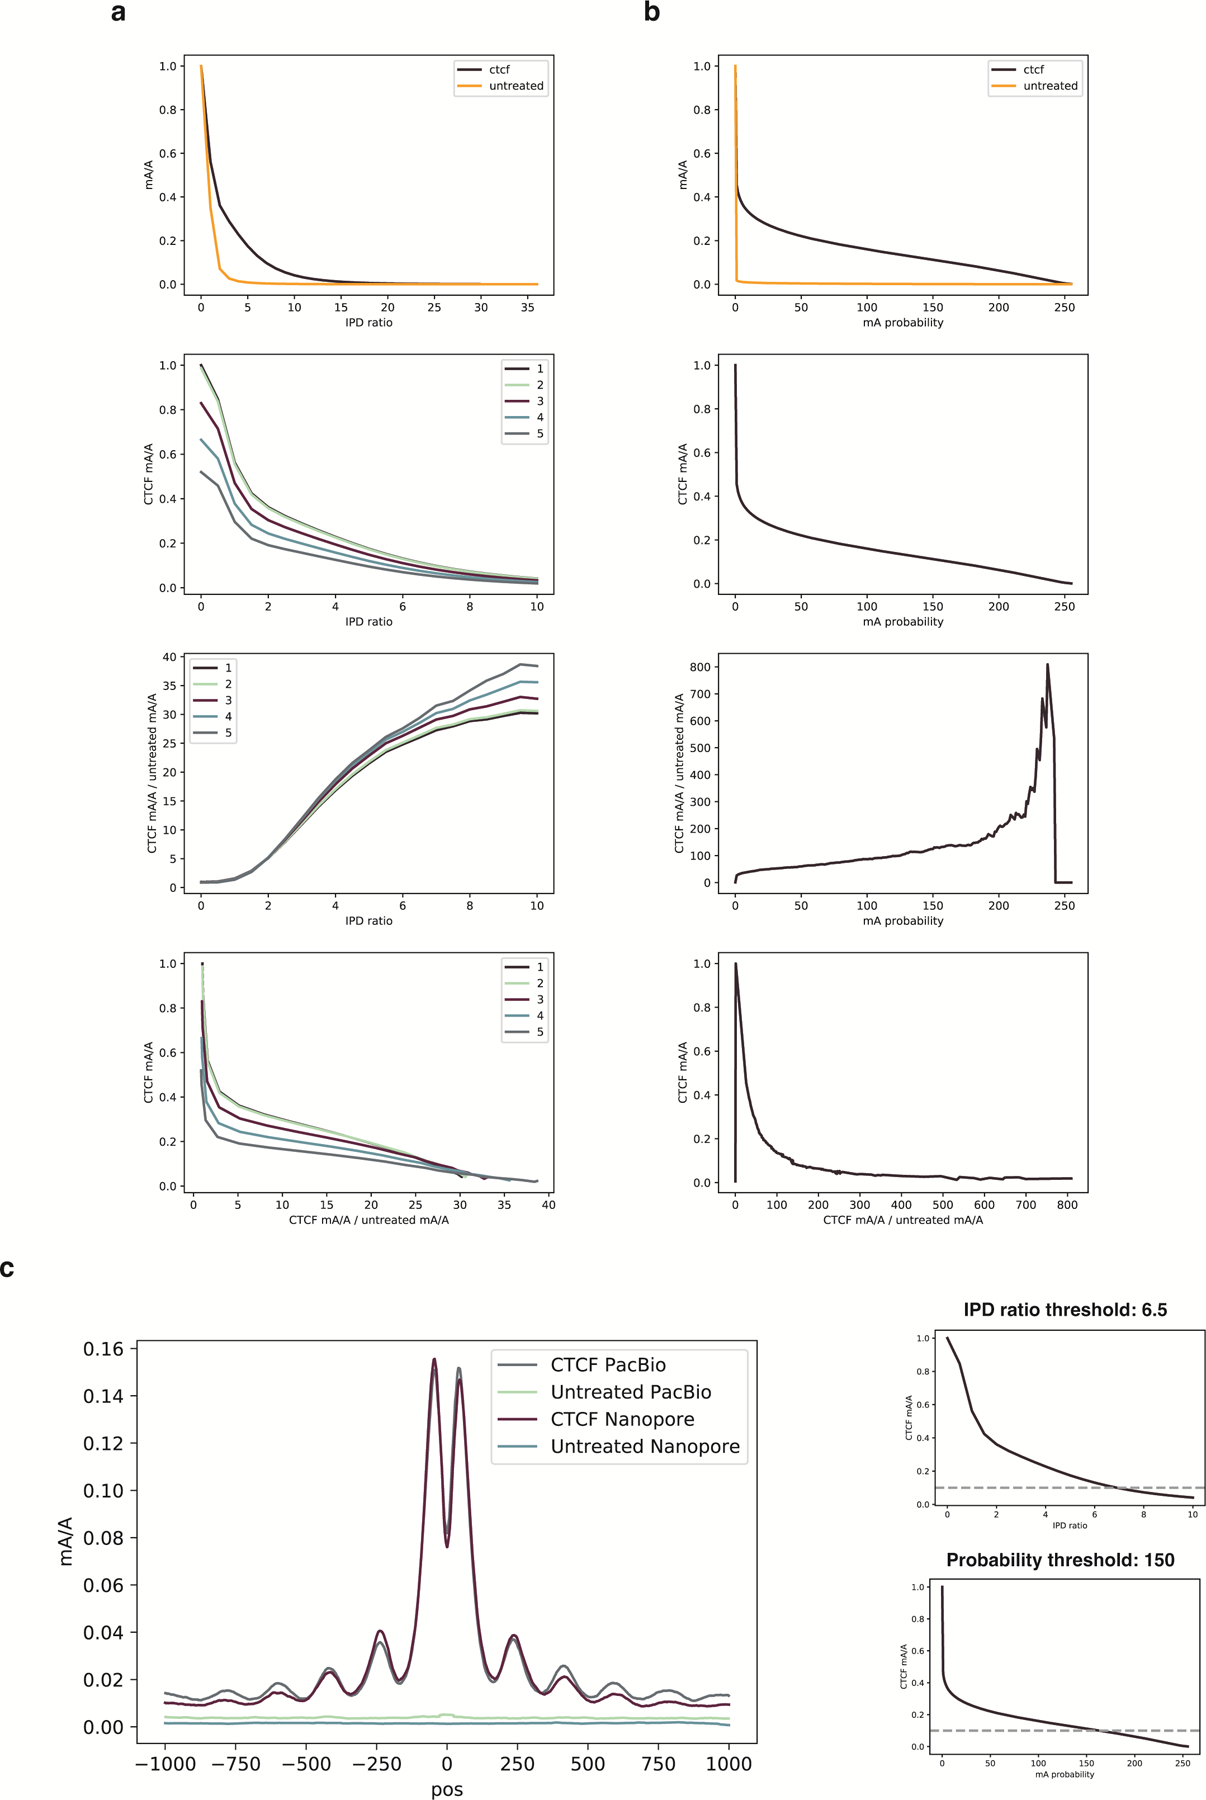
Extended Data Fig. 8. Comparison of PacBio and Nanopore sequencing platforms for detecting mA from DiMeLo-seq.

The same DNA from a DiMeLo-seq experiment targeting CTCF in GM12878 cells was sequenced on both PacBio and Nanopore. The same untreated GM12878 DNA was also sequenced on both platforms. Methylated base calls for reads spanning the top decile of CTCF ChIP-seq peaks are analyzed. a, PacBio data. (i) Fraction of adenines methylated +/− 100 bp (“peak region”) from CTCF motif center as a function of IPD ratio for the CTCF-targeted sample and the untreated control. (ii) Fraction of adenines methylated for CTCF-targeted sample in the peak region for various IPD ratio thresholds and number of pass thresholds (indicated in legend from 1 to 5). (iii) Fraction of adenines methylated in the peak region for CTCF-targeted sample over the fraction for the untreated control as a function of IPD ratio and number of passes (indicated in legend from 1 to 5). (iv) Fraction of adenines methylated in the peak region for CTCF-targeted sample versus the enrichment of CTCF-targeted methylation over the untreated control. b, Nanopore data. Same as in (a), but probability of methylation is the threshold that varies rather than IPD ratio and number of passes. c, For a given fraction of adenines methylated in the peak region, here 0.1 for illustration, the PacBio and Nanopore enrichment profiles are overlaid. The thresholds for each platform for 10% peak methylation are indicated and the number of passes threshold for PacBio is one.
