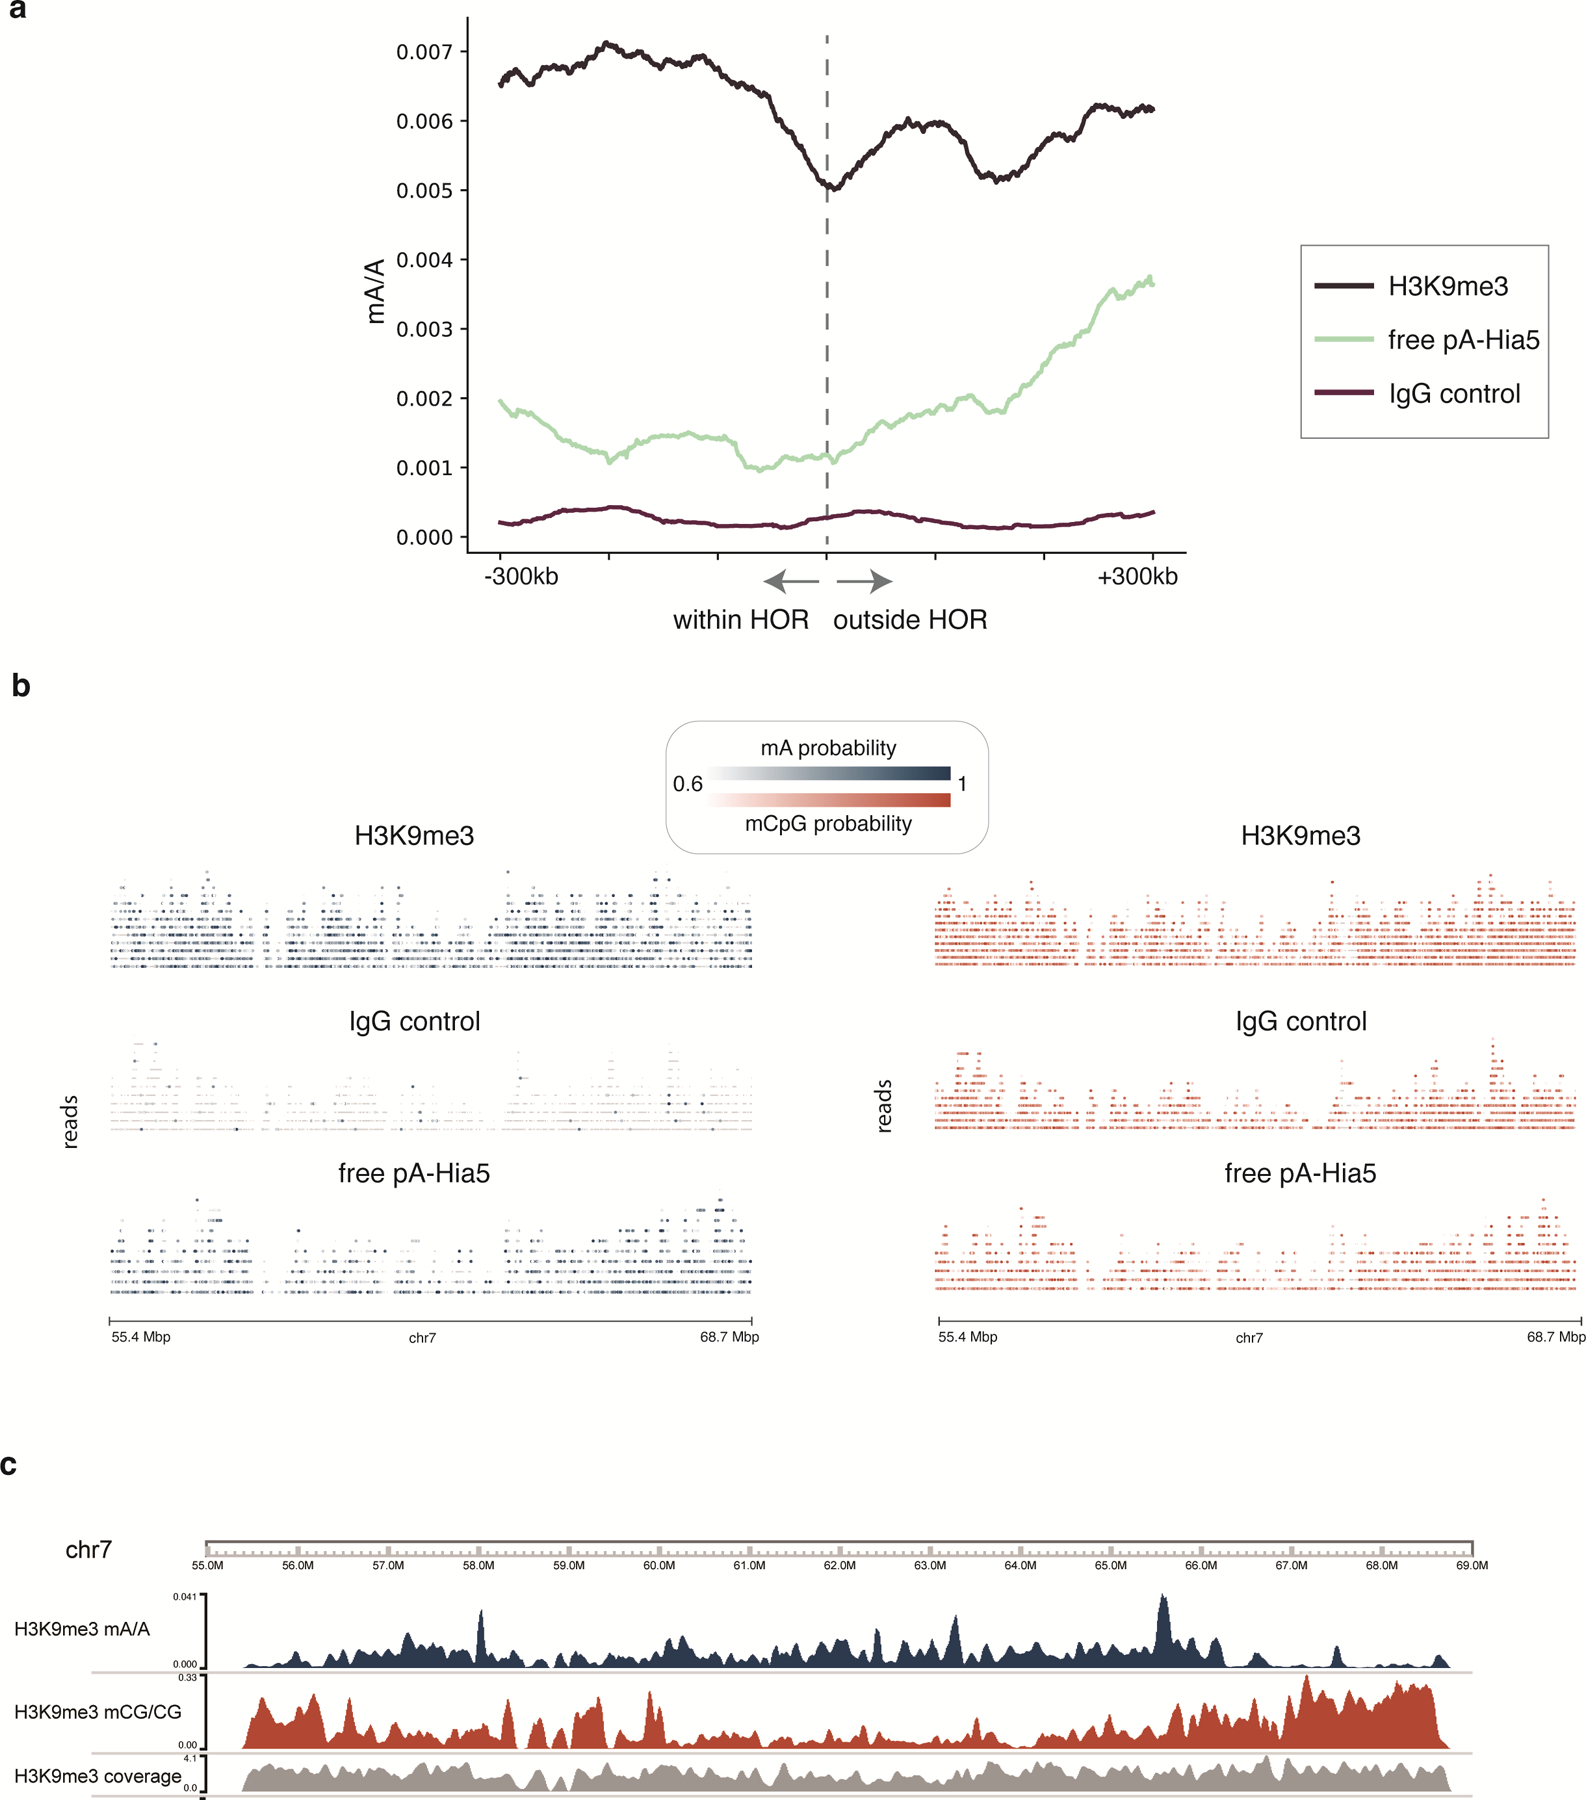
Extended Data Fig. 9. H3K9me3 control analysis at HOR boundaries and in centromere 7.

a, Density of methylated adenines for the H3K9me3-targeted sample and IgG and free pA-Hia5 controls in 100 kb sliding window across HOR boundaries 1p, 2pq, 6p, 9p, 13q, 14q, 15q, 16p, 17pq, 18pq, 20p, 21q, 22q. b, Centromere 7 single molecule browser tracks for H3K9me3-targeted sample, IgG control, and free pA-Hia5. The same molecules are shown in both plots, with mA calls indicated in the first, and mCpG calls indicated in the second. c, Coverage tracks in 10-kb bins to accompany mA/A and mCpG/CpG tracks from Figure 5d.
