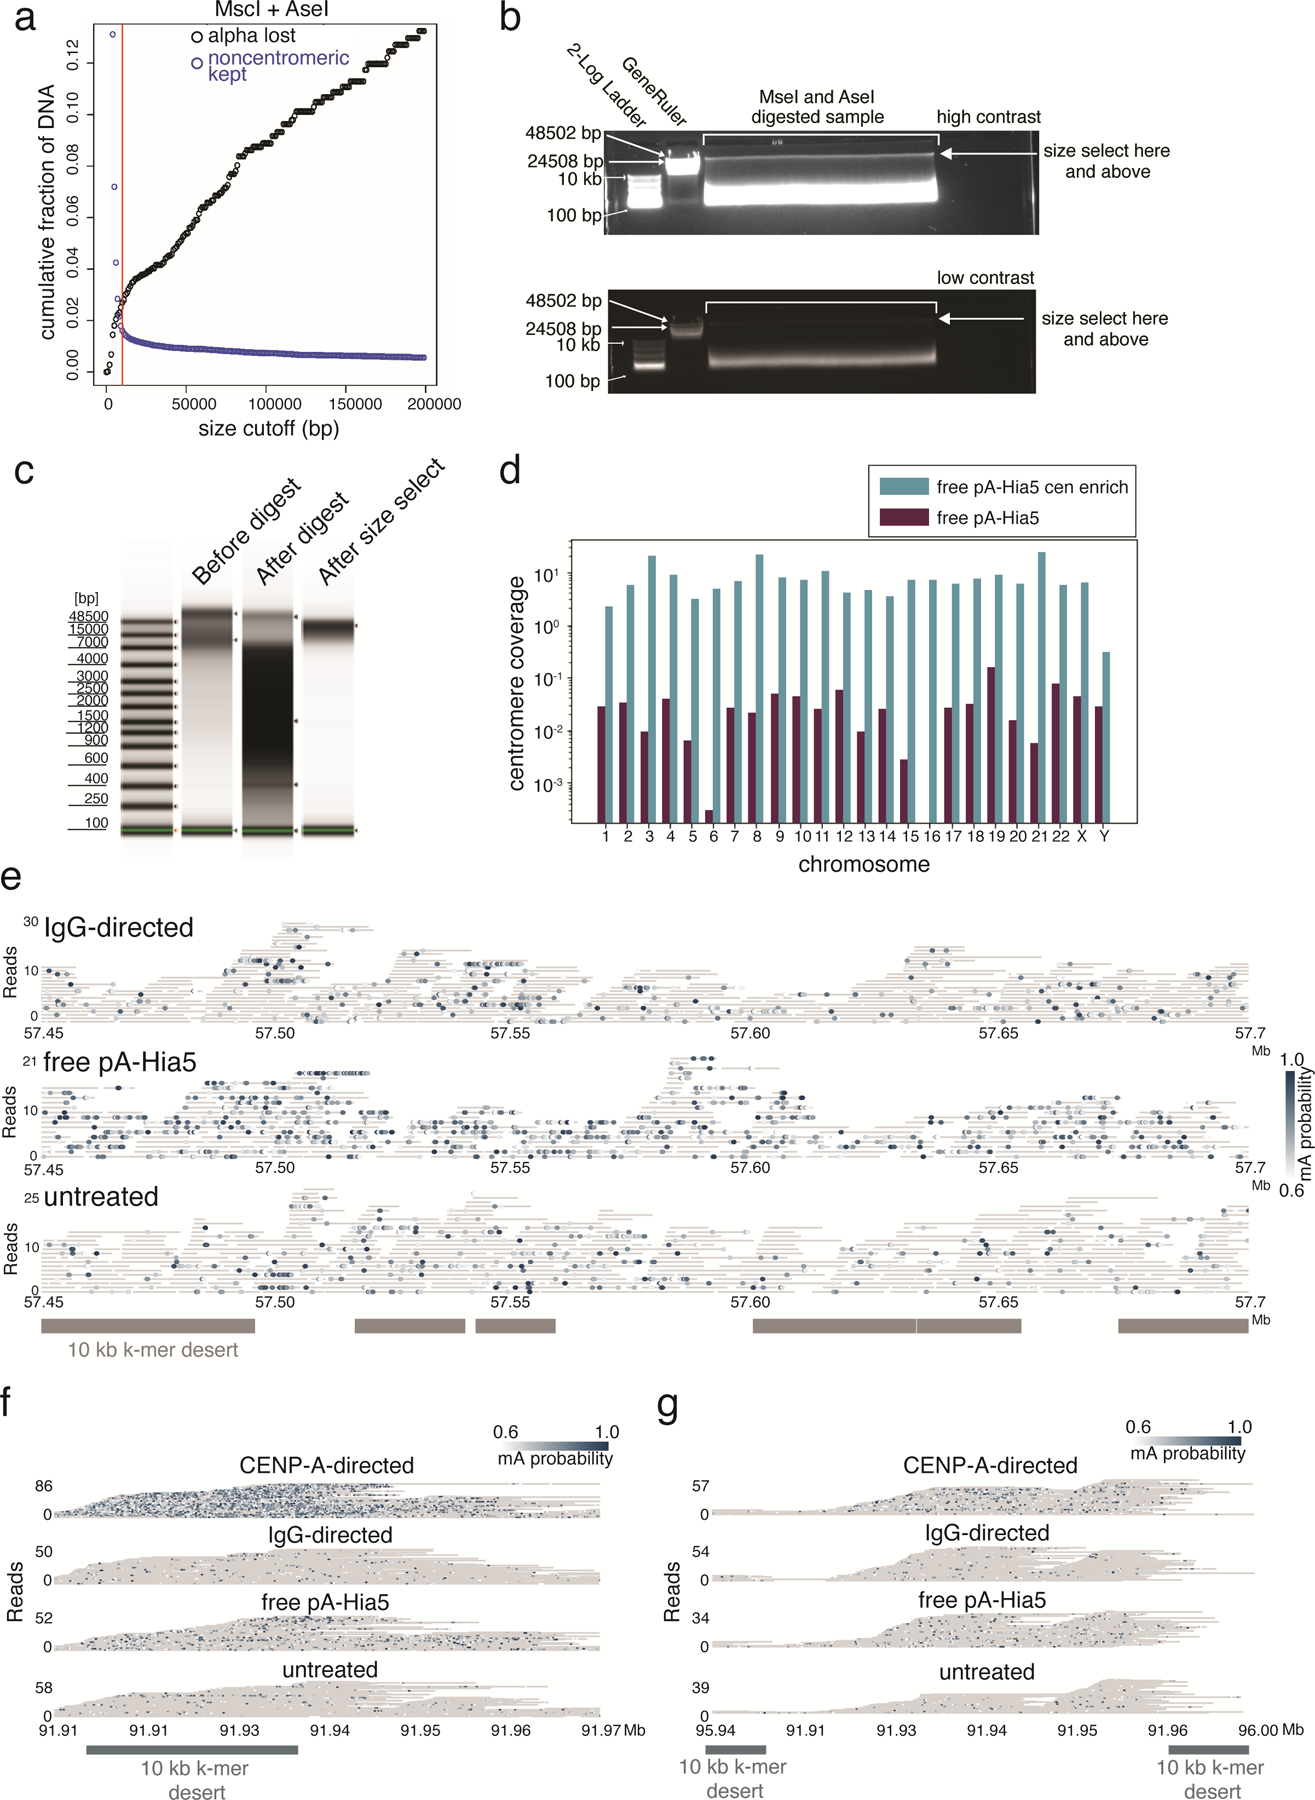
Extended Data Fig. 10. AlphaHOR-RES centromere enrichment and methylation within chromosome X and chromosome 3 HORs.

a, Simulated cumulative distribution of the proportion of alpha-satellite DNA lost (black) and non-centromeric DNA kept (blue) after MscI and AseI digestion of the T2T chm13 genome at different size selection cutoffs. b, High (top) and low contrast (bottom) images of agarose gel run on total genomic DNA after Msc1 and Ase1 digestion. Sample recovered from above cut site (arrow). Representative image of at least 4 replicates. c, genomic DNA tapestation gel image of sample before digestion, after digestion, and after size selection. Representative image of at least 3 replicates. d, Coverage of the active HOR on each chromosome from the CHM13+HG002X+hg38Y reference genome from free floating pA-Hia5 DiMeLo-seq libraries with and without AlphaHOR-RES. e-g, Single molecule view with individual reads in gray and mA depicted as dots for the indicated conditions. Scale bar indicates the probability of adenine methylation (from Guppy) between 0.6 and 1. Regions with at least 10 kb without unique 51 bp k-mers shown in grey to illustrate difficult to map locations for short-read sequencing. e. ChrX CDR (57.45 – 57.7 Mb), f. chromosome 3 HOR between 91.91 and 91.97 Mb, g. chromosome 3 HOR between 95.94 and 96.00 Mb.
