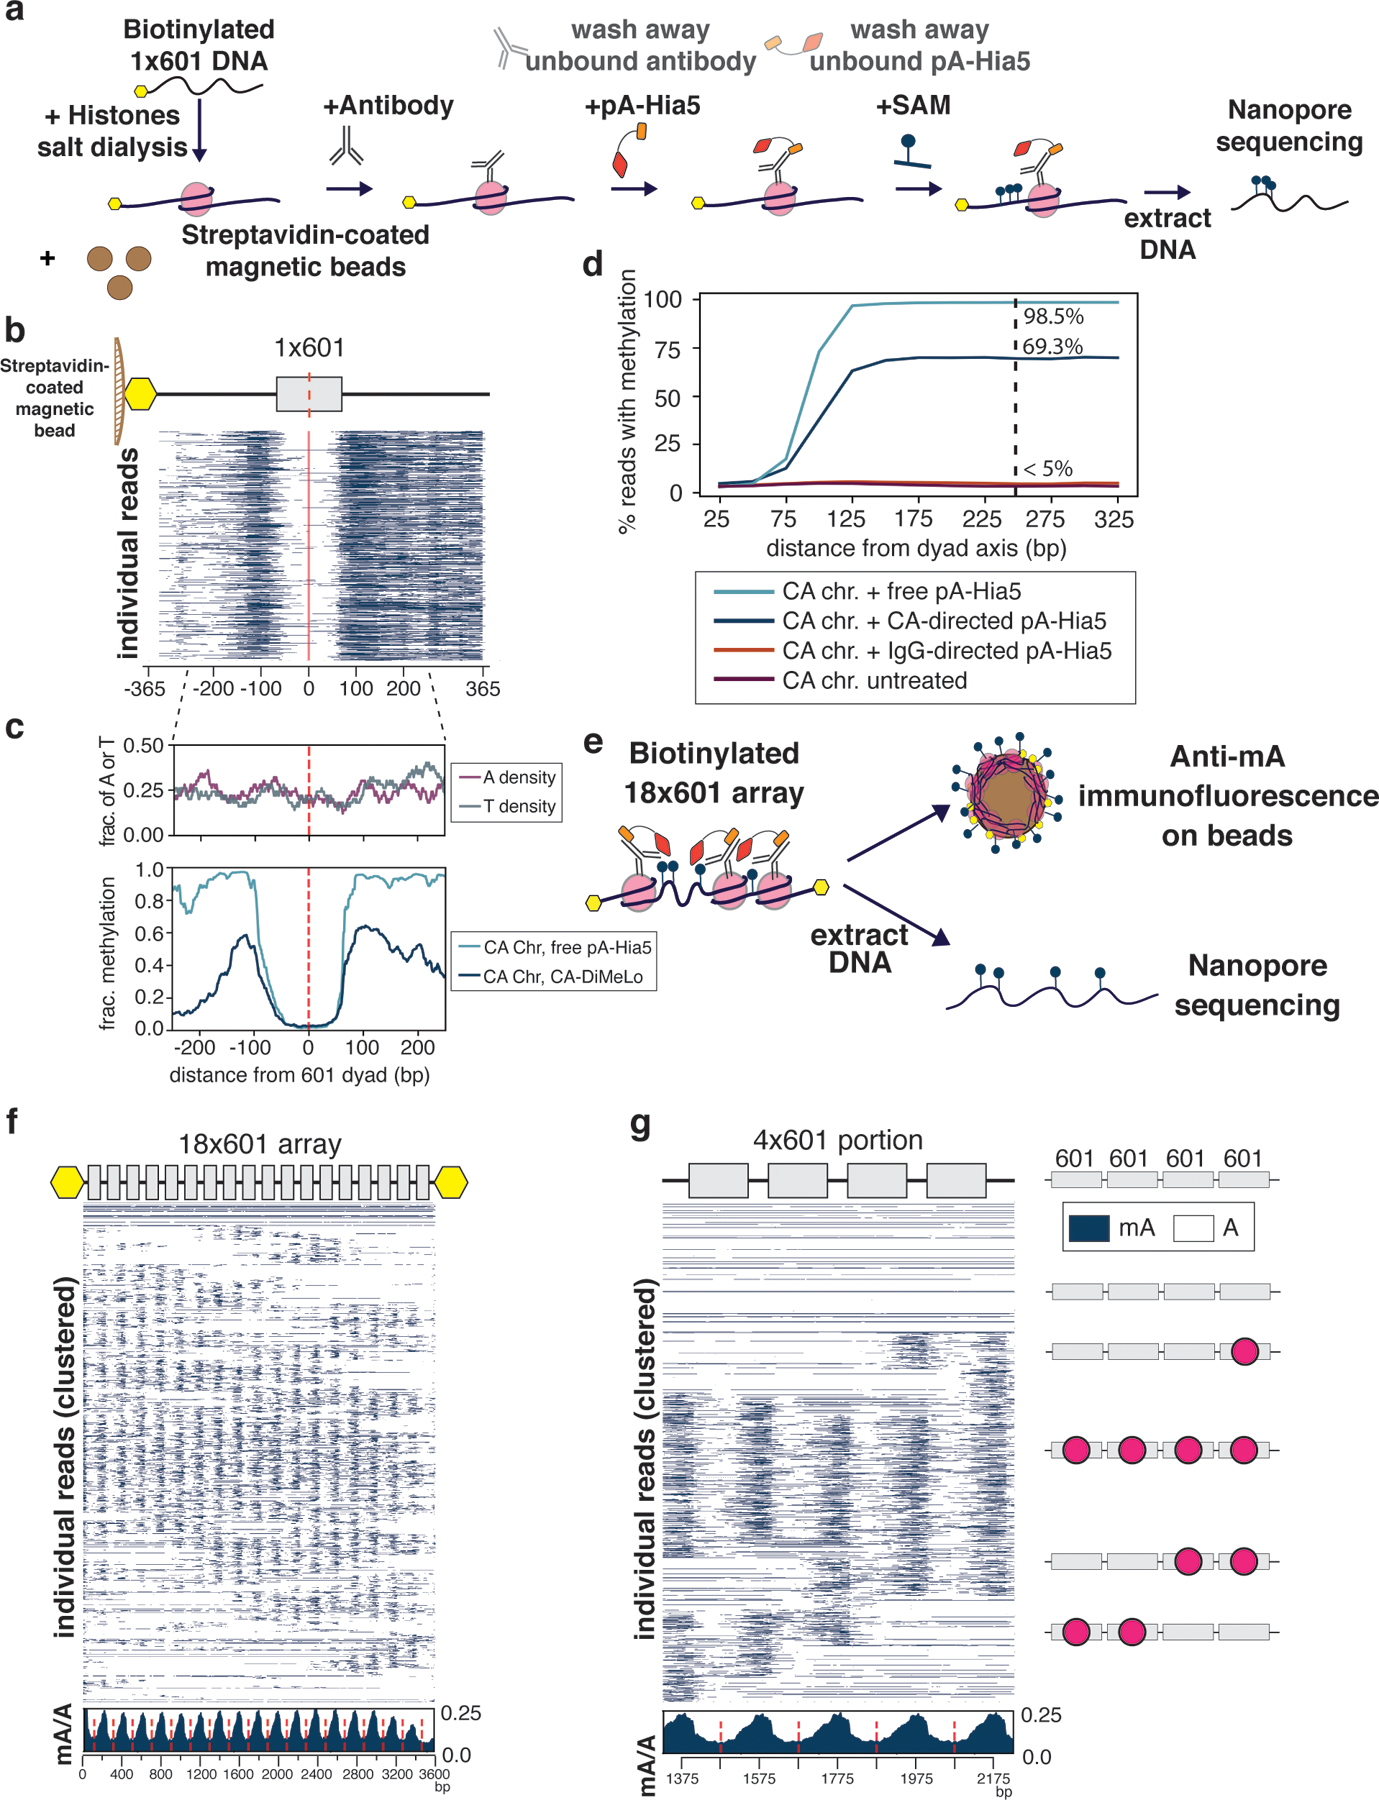
Figure 2. Application of DiMeLo-seq in artificial chromatin.

a, Schematic of antibody-directed methylation of artificial chromatin. b. Heatmap of 5000 individual 1×601 reads from chromatin containing CENP-A mononucleosomes methylated with CENP-A-directed pA-Hia5 (red dashed line indicates 601 dyad position). c, Plots of A or T density (top) and average mA/A on base position of 1×601 containing DNA (bottom) (red dashed line indicates 601 dyad position). d, Plot of percentage of reads with methylation as a function of the distance from dyad axis. e, Schematic of directed methylation of 18×601 chromatin array. f,g, Heatmap of 2000 individual reads from CENP-A chromatin methylation with CENP-A-directed pA-Hia5, hierarchically clustered by jaccard distances of inferred nucleosome positions over the entire 18×601 array (f) or a subset 4×601 region (g) along with cartoons depicting predicted nucleosome positions (red circles). Insets (below) show average mA/A on every base position of 18×601 array or 4×601 portion (red dashed line indicates 601 dyad position).
