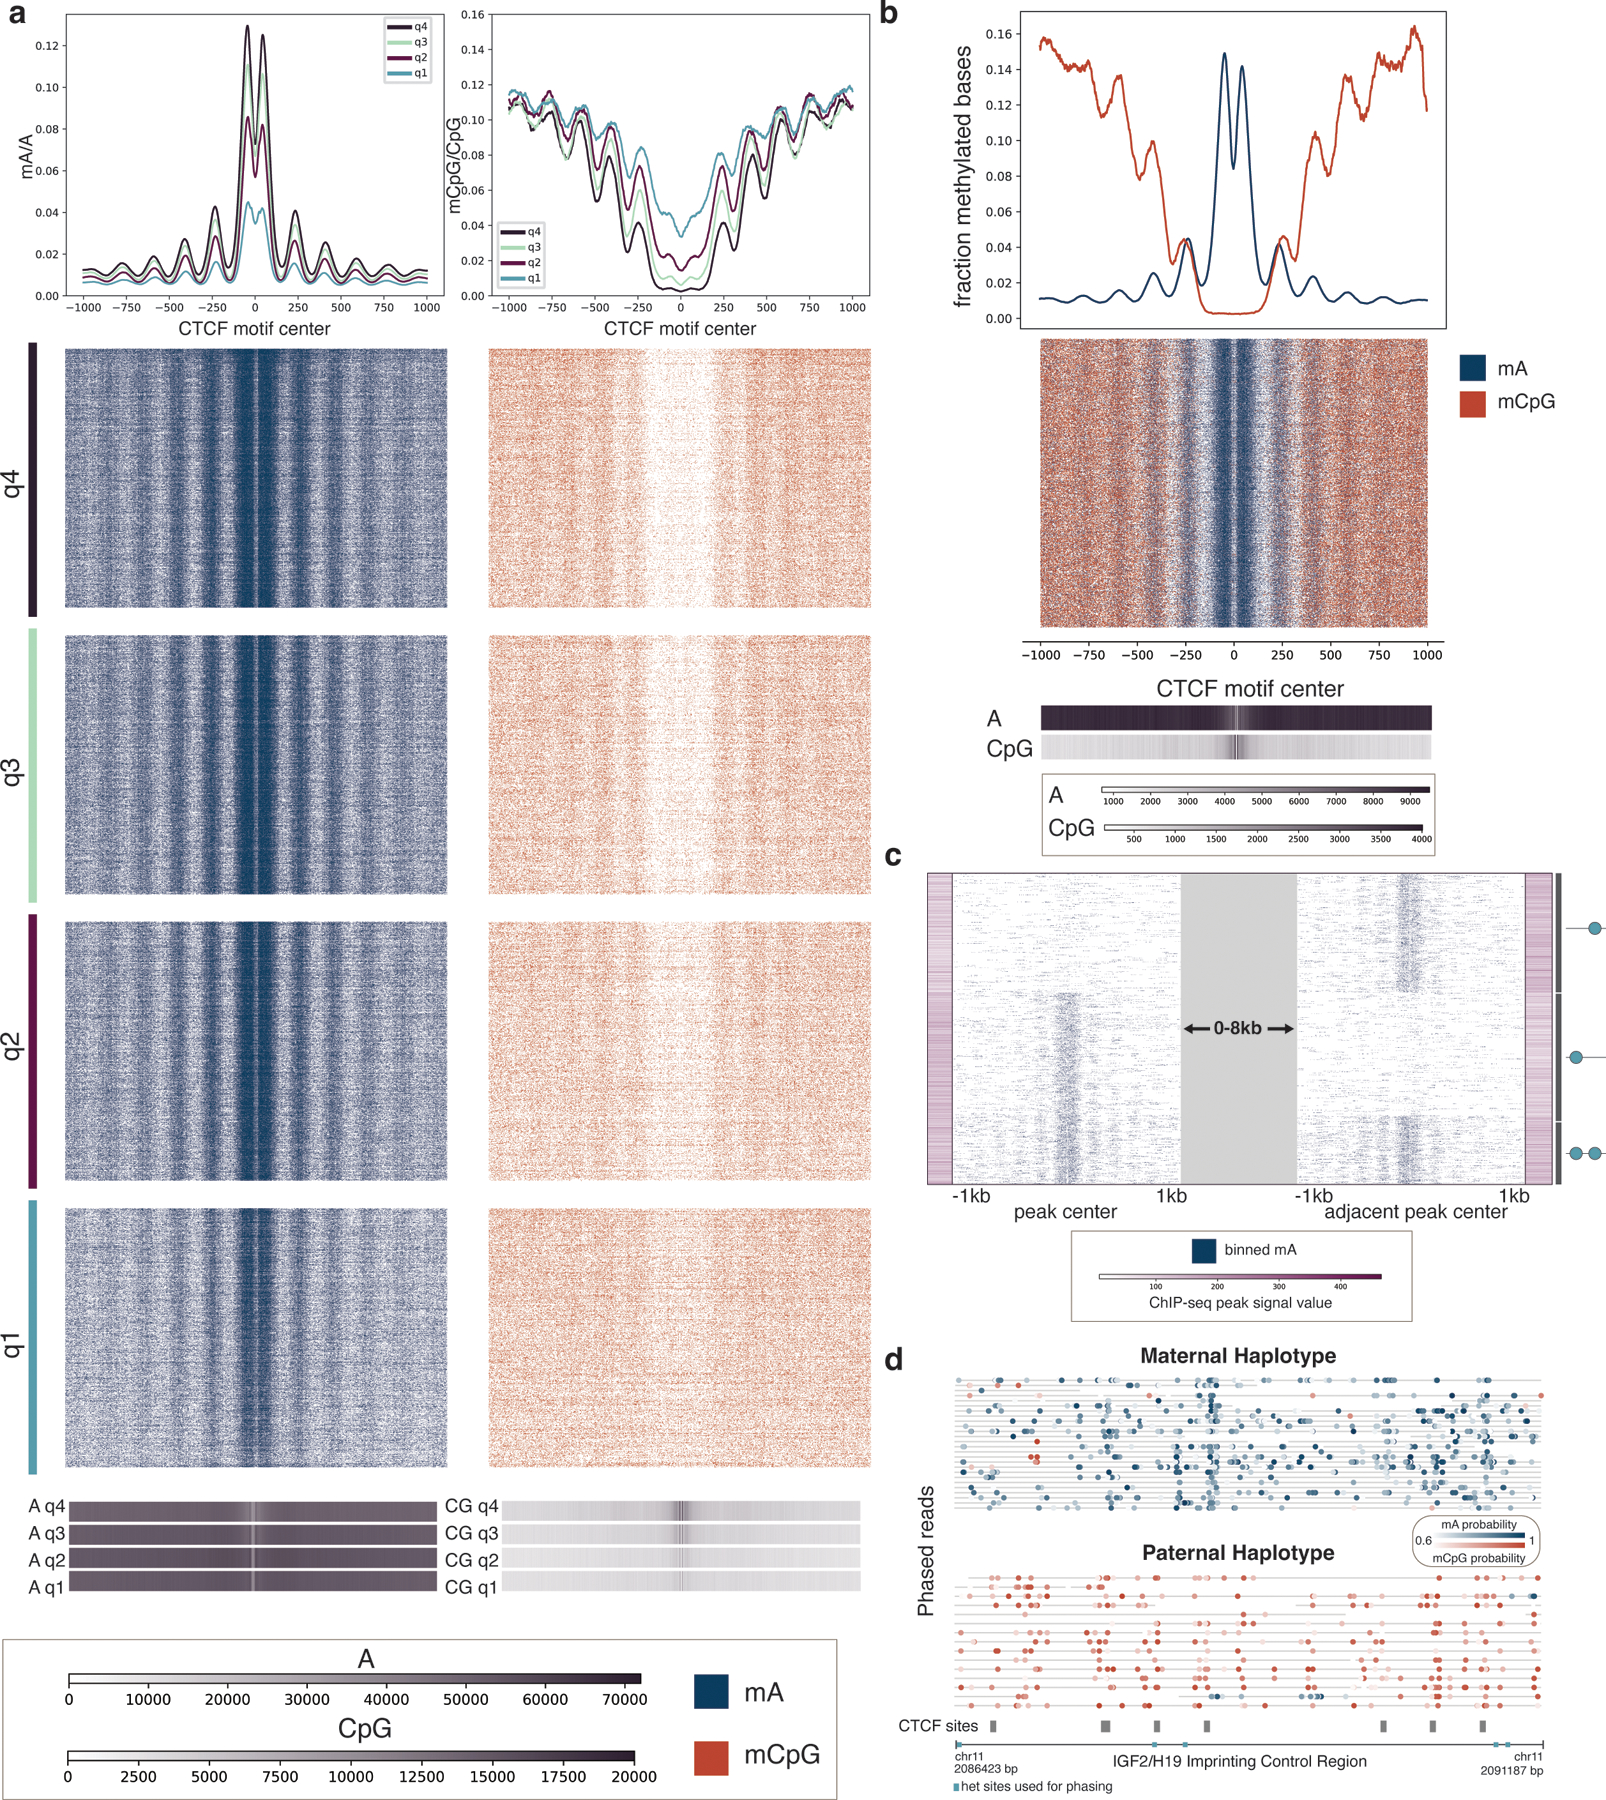
Figure 4. Single-molecule CTCF binding and CpG methylation profiles.

a, Single molecules spanning CTCF ChIP-seq peaks are shown across quartiles of ChIP-seq peak strength. Q4, quartile 4, are peaks with the strongest ChIP-seq peak signal, while Q1, quartile 1, are peaks with the weakest ChIP-seq peak signal. Blue show mA called with probability ≥ 0.75, while orange indicate mCpG called with probability ≥ 0.75. Aggregate curves for each quartile were created with a 50 bp rolling window. Base density across the 2 kb region for each quartile is indicated in the 1D heatmaps; the scale bar indicates the number of adenine bases and CG dinucleotides sequenced at each position relative to the motif center. b, Joint mA and mCpG calls on the same individual molecules spanning CTCF ChIP-seq peaks. Molecules displayed have at least one mA called and one mCpG called with probability ≥ 0.75. Aggregate curves were created with a 50 bp rolling window. Base density is indicated as in (a). c, CTCF site protein occupancy is measured on single molecules spanning two neighboring CTCF motifs within 2–10 kb of one another. CTCF motifs are selected from all ChIP-seq peaks, and molecules are shown that have a peak at at least one of the two motifs. Each row is a single molecule, and the molecules are anchored on the peaks that they span, with a variable distance between the peaks indicated by the grey block. ChIP-seq peak signal for each of the motif sites is indicated with the purple bars. The graphic on the side illustrates the CTCF binding pattern for each cluster. d, Phased reads across the IGF2/H19 Imprinting Control Region with CTCF sites indicated in grey. Blue dots represent mA calls and orange dots represent mCpG calls. Heterozygous sites used for phasing are indicated in turquoise.
