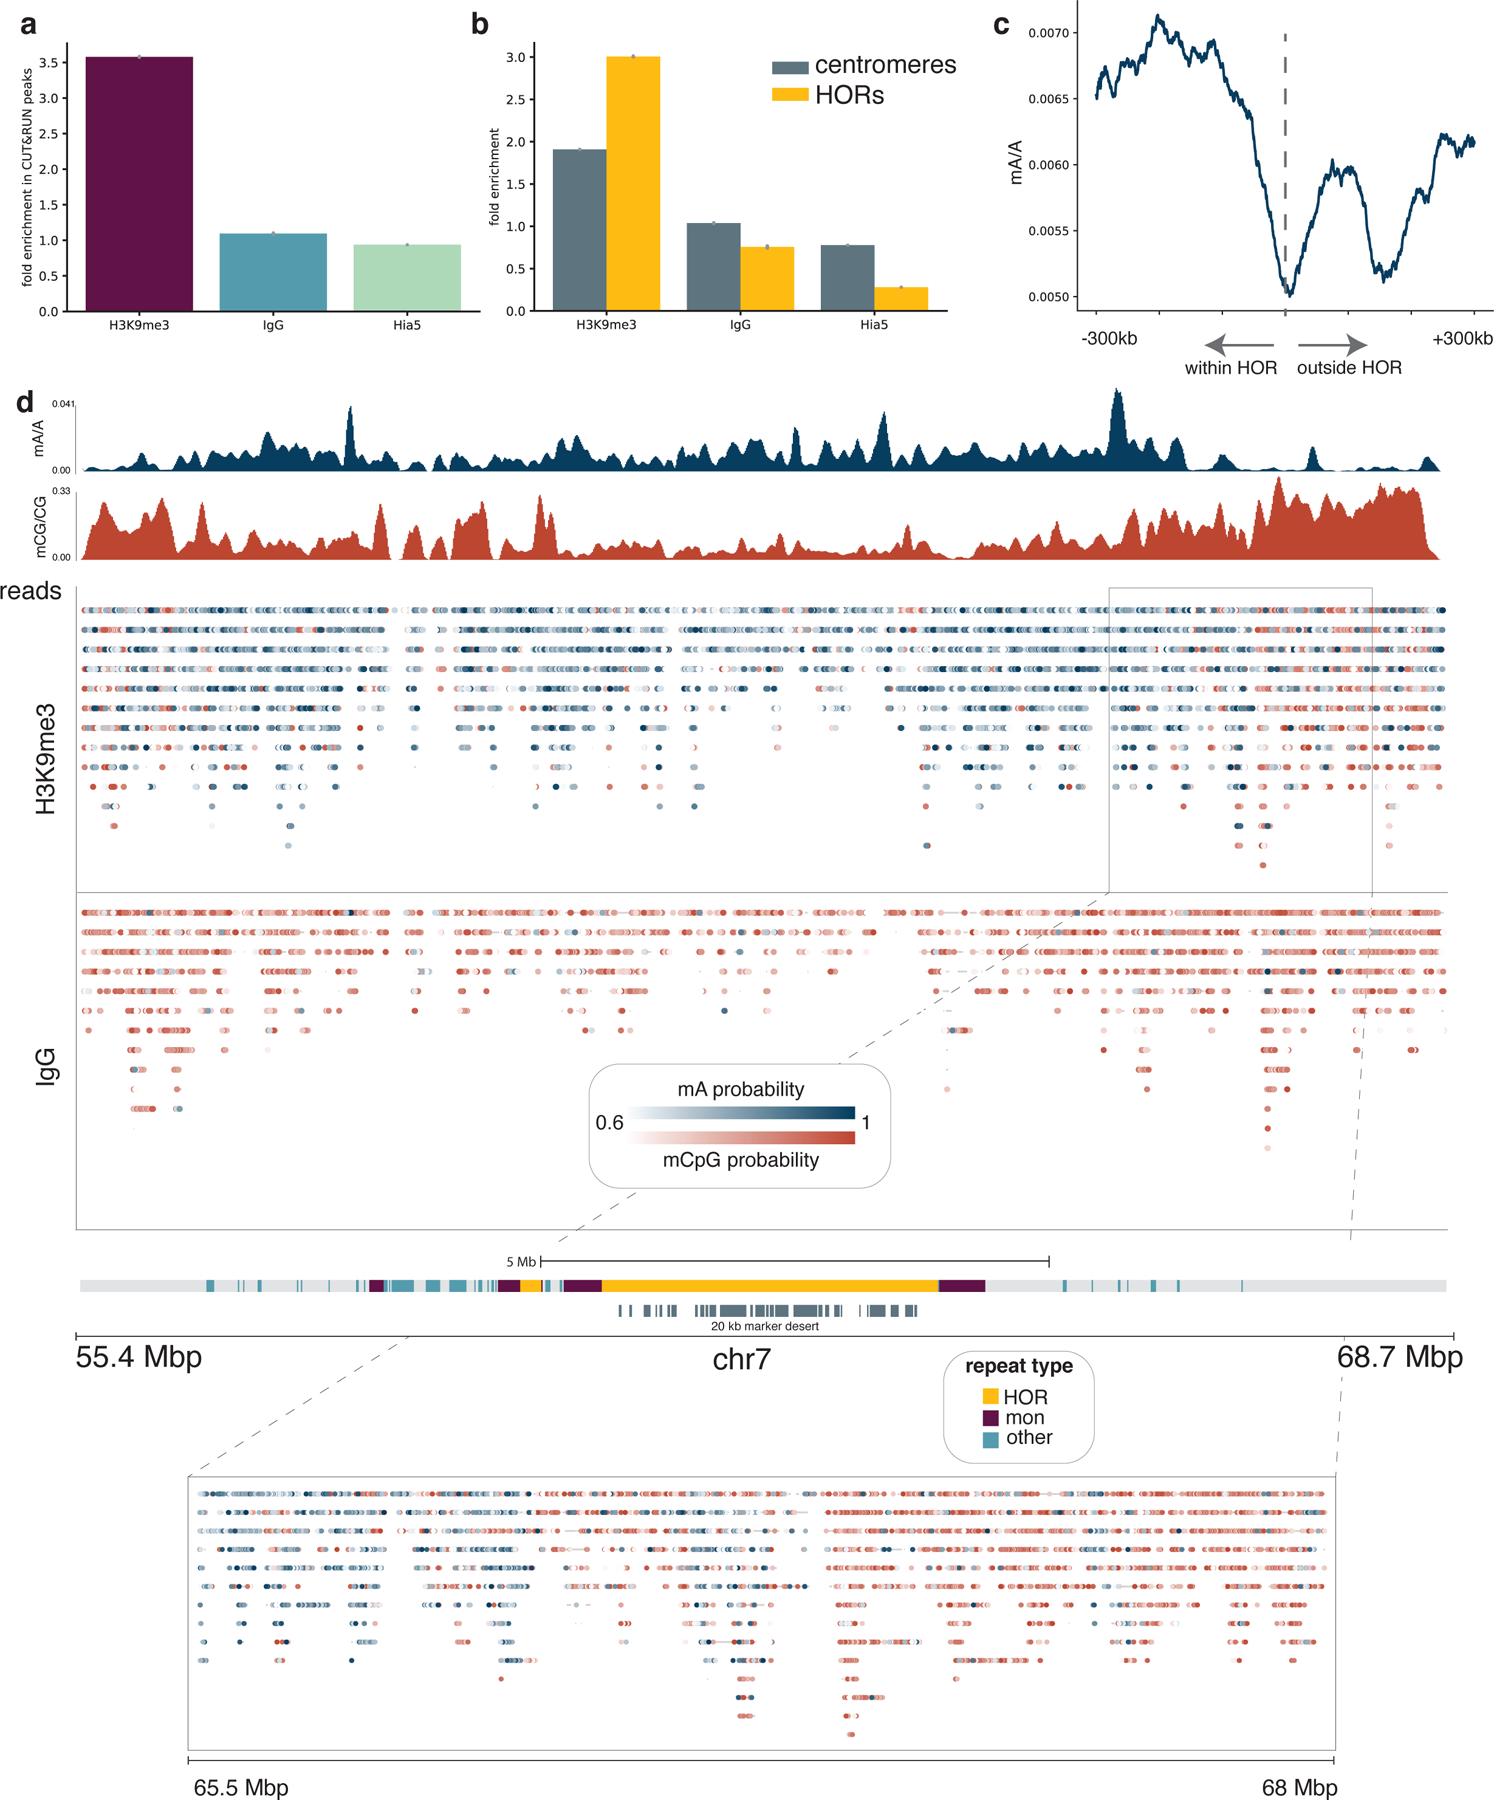
Figure 5. Detecting H3K9me3 in centromeres.

a, The proportion of adenines methylated within CUT&RUN peaks relative to the proportion of adenines methylated outside of CUT&RUN broad peak regions is reported for the H3K9me3-targeted sample as well as IgG and free pA-Hia5 controls. Error bars represent 95% credible intervals determined for each ratio by sampling from posterior beta distributions computed with uninformative priors. b, The fraction of adenines methylated within centromeres relative to non-centromeric regions, and similarly the fraction of adenines methylated within active HOR arrays relative to non-centromeric regions are displayed for the H3K9me3-targeted sample as well as the IgG and free pA-Hia5 controls. Error bars are defined as in (a). c, The decline in mA/A for the H3K9me3-targeted sample in a rolling 100 kb window from −300 kb within the HOR array to 300 kb outside of the HOR array. HOR array boundaries that transition quickly into non-repetitive sequences were considered: 1p, 2pq, 6p, 9p, 13q, 14q, 15q, 16p, 17pq, 18pq, 20p, 21q, 22q. d, Single molecules are displayed across the centromere of chromosome 7 for the H3K9me3-targeted sample and the IgG control. Reads mapping to the same position are displayed vertically, and modified bases are colored by the probability of methylation at that base for probabilities ≥ 0.6. Aggregate tracks show mA/A and mCpG/CpG in the H3K9me3-targeted sample in 10 kb bins. Grey bars below centromere annotation indicate regions with >20 kb marker deserts.
