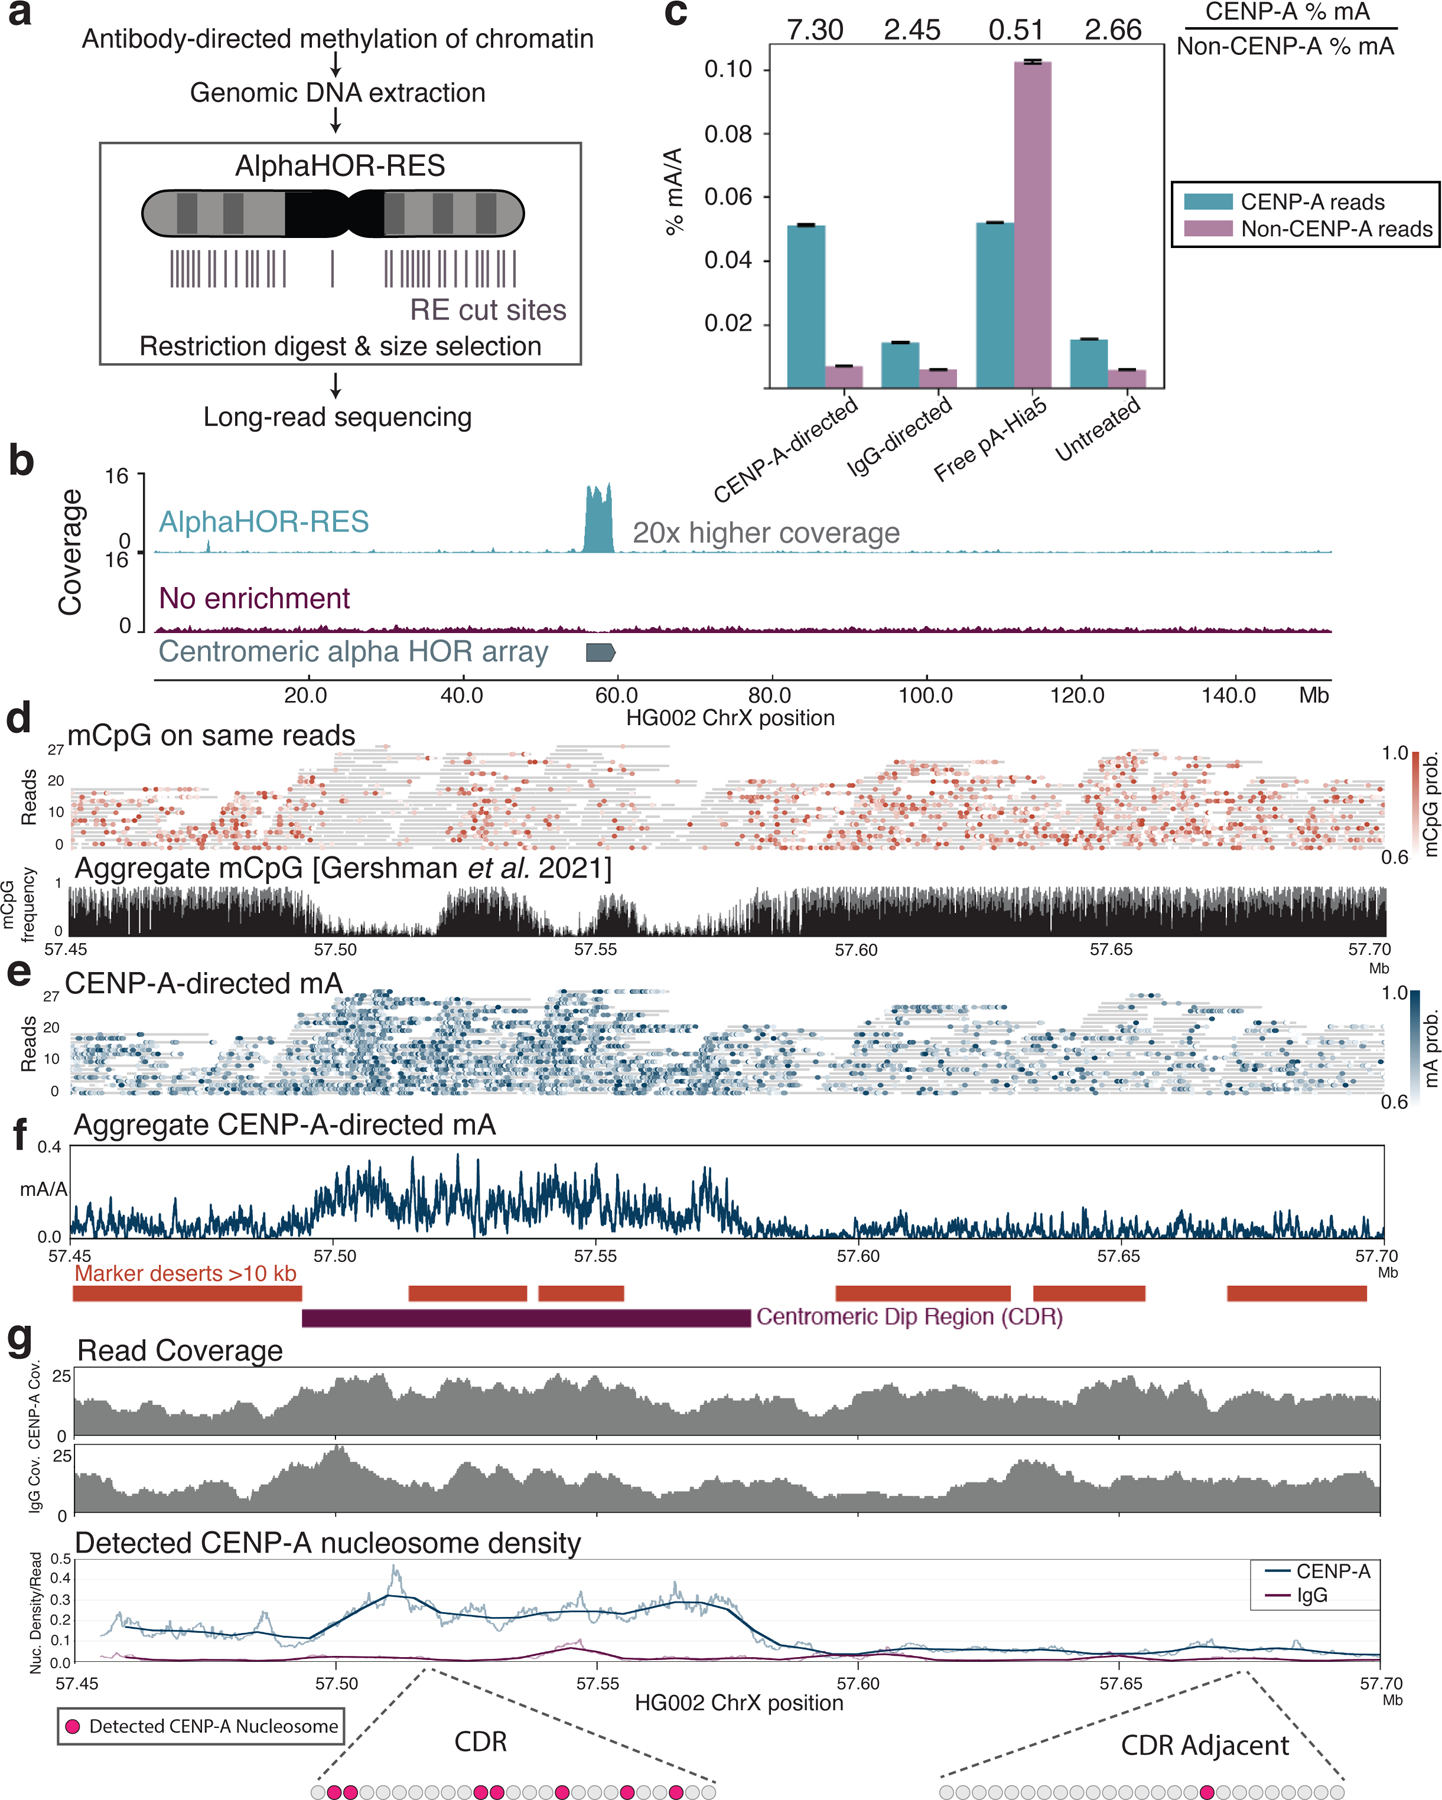
Figure 6. CENP-A-directed methylation within chromosome X centromeric higher order repeats.

a, Schematic of DiMeLo-seq with AlphaHOR-RES centromere enrichment. b, Genome browser plot on HG002 chromosome X of read coverage from DiMeLo-seq libraries with centromere enrichment (top) or without (middle). Bottom track depicts the region of the alpha satellite array. c, Barplot of percentage mA/A (using a stringent Guppy probability threshold of 0.95) for reads from each library that contain or do not contain CENP-A enriched k-mers. Fold enrichment of methylation percentage on CENP-A reads over Non-CENP-A reads reported on top. Error bars represent 95% confidence intervals. d, View of a 250 kb region spanning the CDR within the active chrX HOR array. (top) Single-molecule view, with individual reads as gray lines and mCpG positions as orange dots shaded by Guppy’s methylation probability. (bottom) CpG methylation frequency from nanopore sequencing reported in 35. e, Single-molecule view of reads in (d). mA positions are depicted as blue dots shaded by Guppy’s methylation probability. f, Aggregate view of mA. mA/A plot indicates the fraction of reads with a Guppy methylation probability above 0.6 at each adenine position (averaged over a 250 bp rolling window for visualization). Marker deserts (regions of at least 10 kb without unique 51 bp k-mers) are shown in orange to illustrate difficult-to-map locations for short-read sequencing. g, For CENP-A or IgG control DiMeLo-seq, read coverage (top plots) and average fraction of nucleosomes detected as CENP-A (bottom plot) per read in sliding 5 kb windows (step size 1 bp), providing a measure of the density of CENP-A nucleosomes within single DNA molecules across the region. Thick lines indicate a 25 kb rolling average. Cartoon below shows representations of detected CENP-A nucleosomes within a 5 kb region corresponding to the CDR or CDR-adjacent region.
