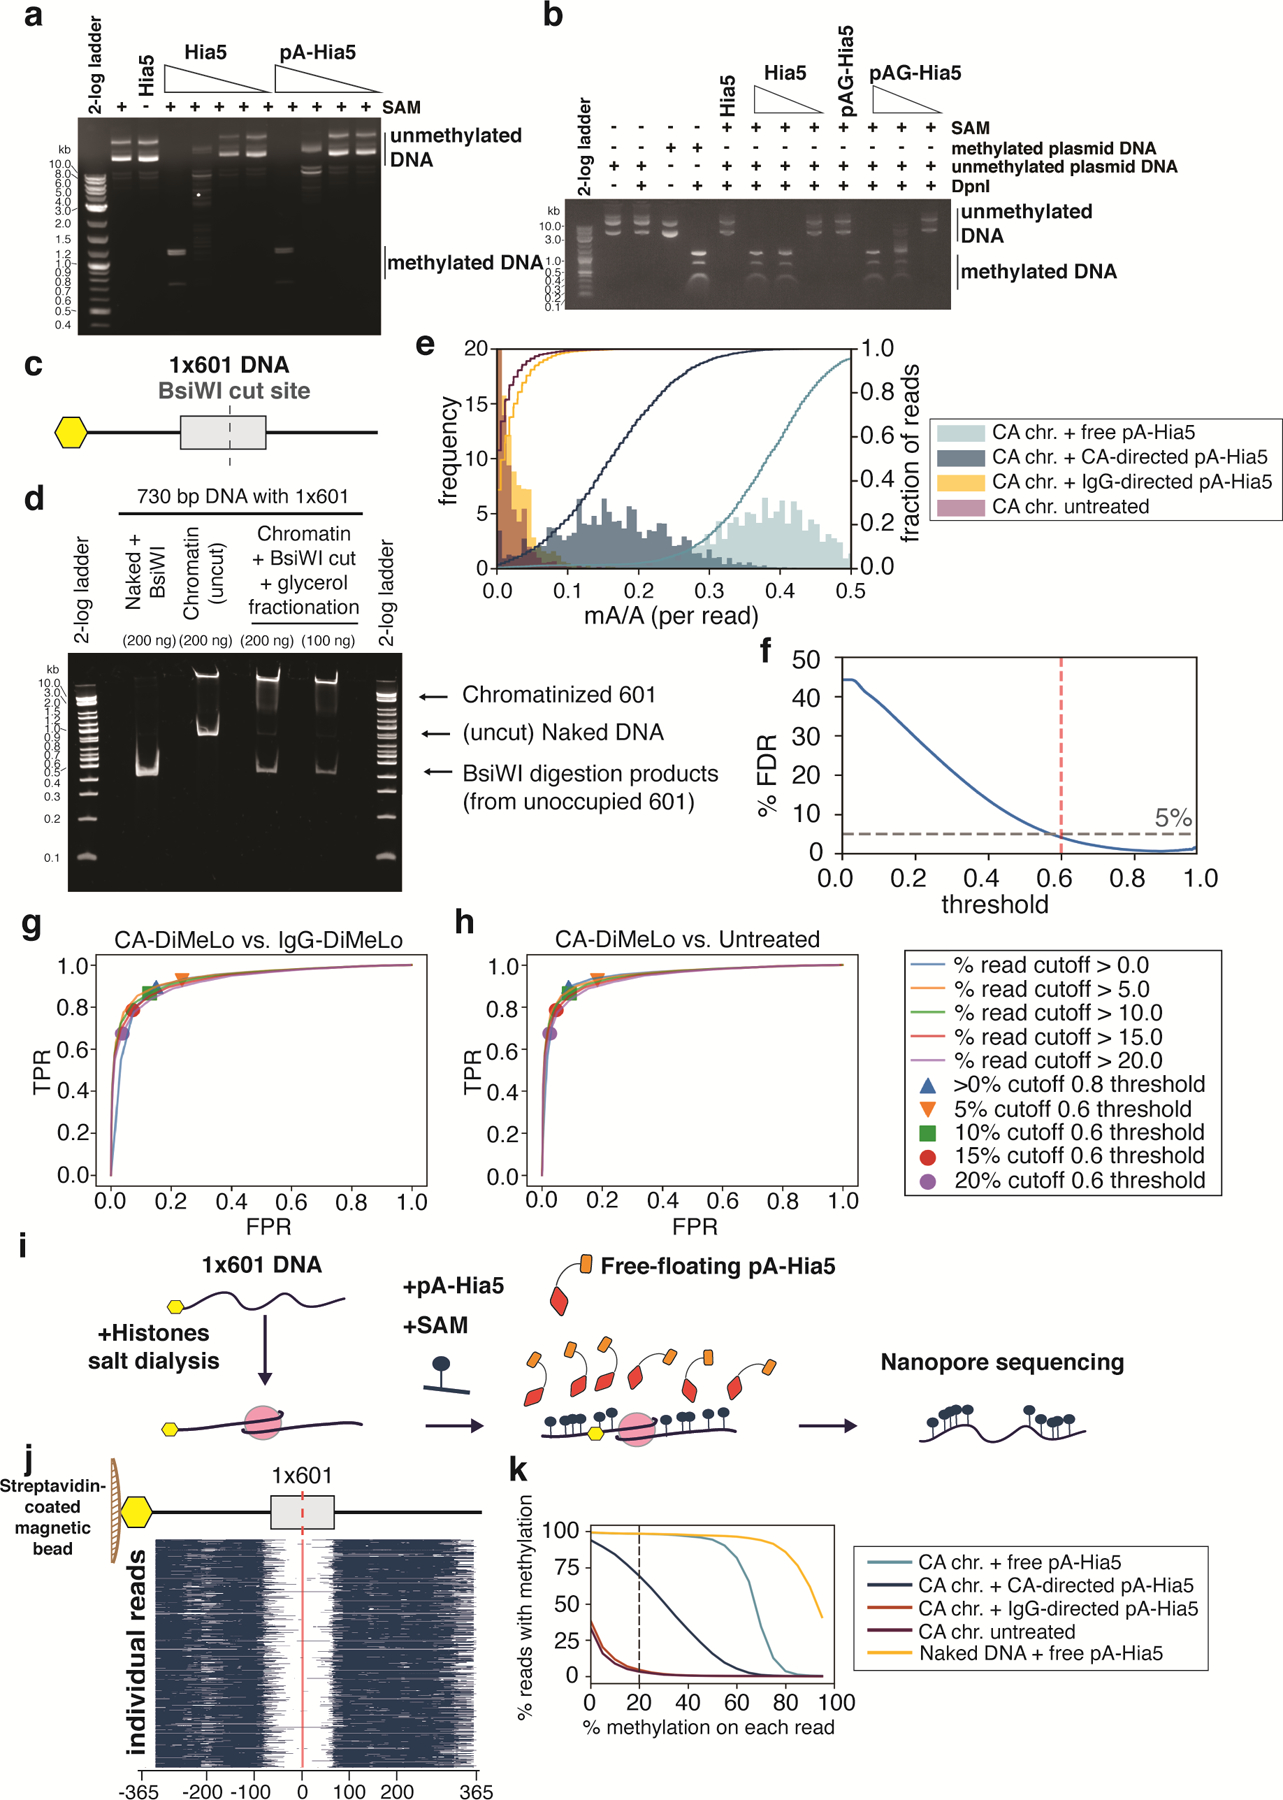
Extended Data Fig. 1. In vitro assessment of methylation of DNA and chromatin by pA-Hia5 and pAG-Hia5.

a,b, Agarose gel electrophoresis image of DpnI digestion of (unmethylated) plasmid DNA following incubation with Hia5, pA-Hia5 (a), or pAG-Hia5 (b) (Supplementary Note 1). Representative images of at least 2 replicates. c, Schematic of 1×601 DNA sequence. Grey box indicates 601 sequence, Yellow hexagon indicates end with biotin. d, Native polyacrylamide gel electrophoresis of naked 1×601 DNA or chromatinized 1×601 DNA before and after BsiWI digestion and glycerol gradient fractionation. Representative image of at least 2 replicates. e, Histogram (filled bars, left axis) and cumulative distribution (line traces, right axis) of fraction of methylation (mA/A) on reads from CENP-A 1×601 chromatin methylated with free pA-Hia5, CENP-A-directed pA-Hia5, IgG-directed pA-Hia5, or untreated. Left y-axis is truncated at 20 for better visualization. f, Plot showing percentage false discovery rate plotted against binned minimum mA probability score (Supplementary Note 4). Dotted lines indicates threshold - 0.6, 5% FDR. g,h, Receiver Operator Characteristic (ROC) curves comparing fraction of methylated reads from 1×601 CENP-A chromatin after CENP-A-directed methylation (True Positive Rate) to IgG-directed methylation (g) or no treatment (h) (False Positive Rate). Areas under the curves (AUC) for the ROC curves range between 0.92 and 0.94 for (g), and between 0.92 and 0.95 for (h). i, Schematic of methylation of accessible DNA on 1×601 CENP-A chromatin co-incubated with free pA-Hia5 and SAM. j, Heatmap showing methylation on 5000 individual reads from CENP-A chromatin following incubation with free pA-Hia5. Blue indicates methylation above threshold (0.6). k, Line plot showing percentage of reads with methylation as a function of the minimum percentage of methylation on each read. (methylation threshold - 0.6). Dotted line corresponds to methylation on at least 20% of each read (used in figure 2d).
