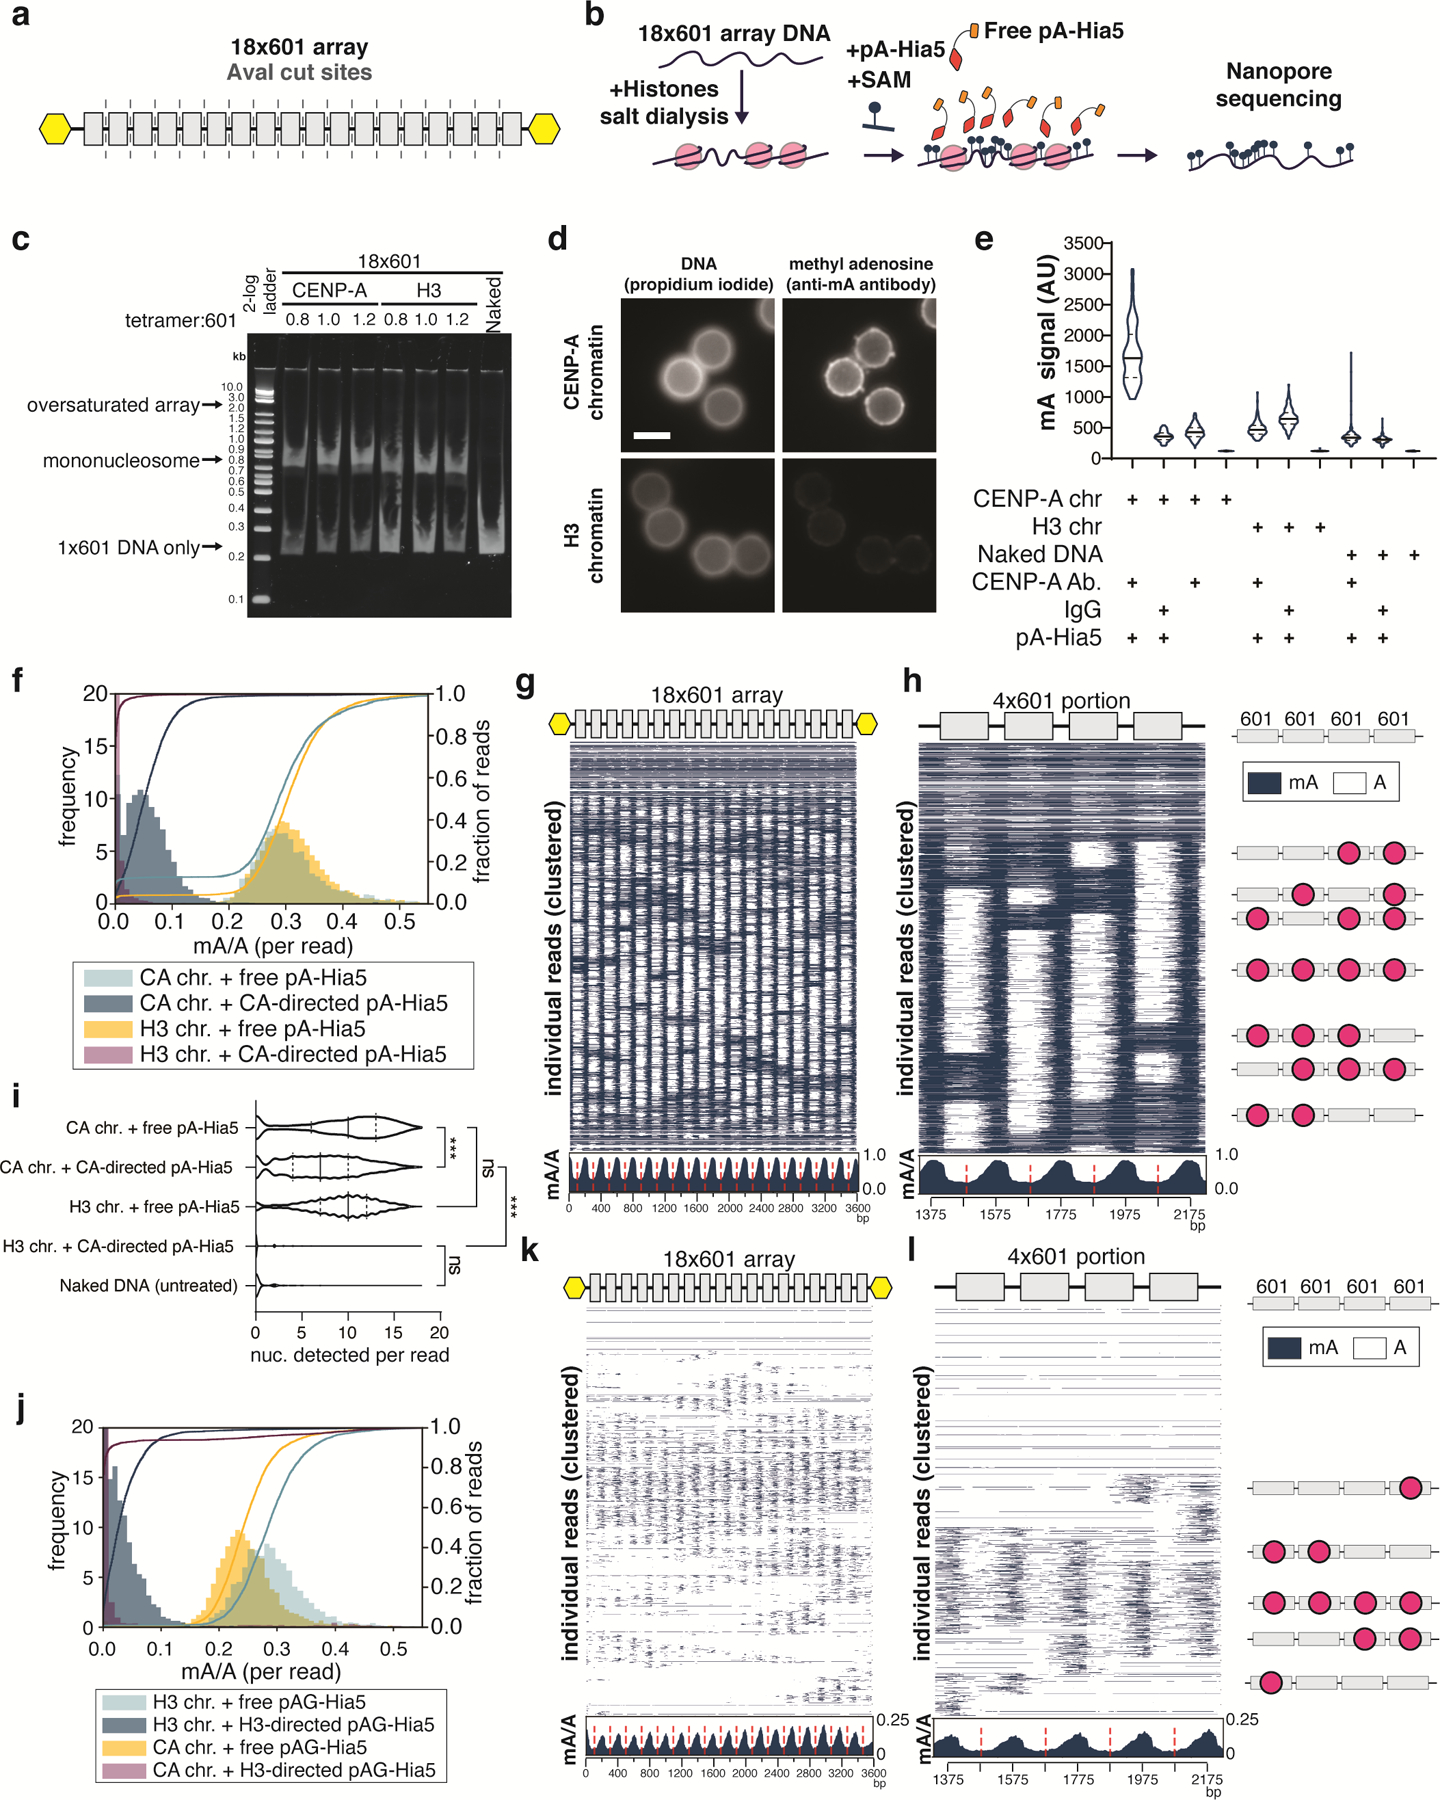
Extended Data Fig. 2. In vitro assessment of methylation of 18×601 array chromatin by pA-Hia5 and pAG-Hia5.

a, Schematic showing the location of 601 sequences (grey boxes) and AvaI digestion sites (dashed line) in between 601 sequences on the 18×601 array. Yellow hexagons indicate biotinylation. b, Schematic of methylation of 18×601 chromatin reconstitution, incubation with free pA-Hia5 and SAM, and long-read sequencing of methylated DNA extracted from chromatin. c, Native polyacrylamide gel electrophoresis showing AvaI digested naked 18×601 array DNA or 18×601 chromatin array reconstituted with CENP-A or H3 (Supplementary Note 2). Representative gel image of at least 3 replicates. d, Representative immunofluorescence images of chromatin-coated beads following methylation using CENP-A-directed pA-Hia5. Scale bar - 3 microns. e, Violin plots of immunofluorescence signal on (denatured) chromatin-coated beads following antibody-directed methylation. Solid line - median, dashed line - quartiles. n > 90 beads/condition. (Supplementary Note 5) f, Histogram (filled bars, left axis) and cumulative distribution (line traces, right axis) of fraction of methylation (mA/A) on reads from CENP-A or H3 chromatin methylated with free pA-Hia5 or CENP-A-directed pA-Hia5. Left y-axis is truncated at 20 for better visualization. g,h, Heatmap showing methylation on 2000 individual reads from CENP-A chromatin methylation with free pA-Hia5, clustered over the entire 18×601 array (g) or a subset 4×601 region (Supplementary Note 4) along with cartoons depicting predicted nucleosome positions (red circles) (h). Insets below heatmaps show average mA/A on every base position of 18×601 array or 4×601 portion. (red dashed line indicates 601 dyad position). i, Violin plot of nucleosomes detected per read on reads from CENP-A or H3 18×601 chromatin array methylated with free pA-Hia5, or CENP-A-directed pA-Hia5. Solid line - median, dashed lines - quartiles. n = 3000 reads. Statistical significance was calculated using Kruskal-Wallis test. *** - P-value < 0.0001 ns - P-value > 0.05. j, Histogram (filled bars, left axis) and cumulative distribution (line traces, right axis) of fraction of methylation (mA/A) on reads from CENP-A or H3 chromatin methylated with free pA-Hia5 or CENP-A-directed pA-Hia5. Left y-axis is truncated at 20 for better visualization. K,l, Same as g,h, but corresponding to H3 chromatin methylation with H3-directed pAG-Hia5.
