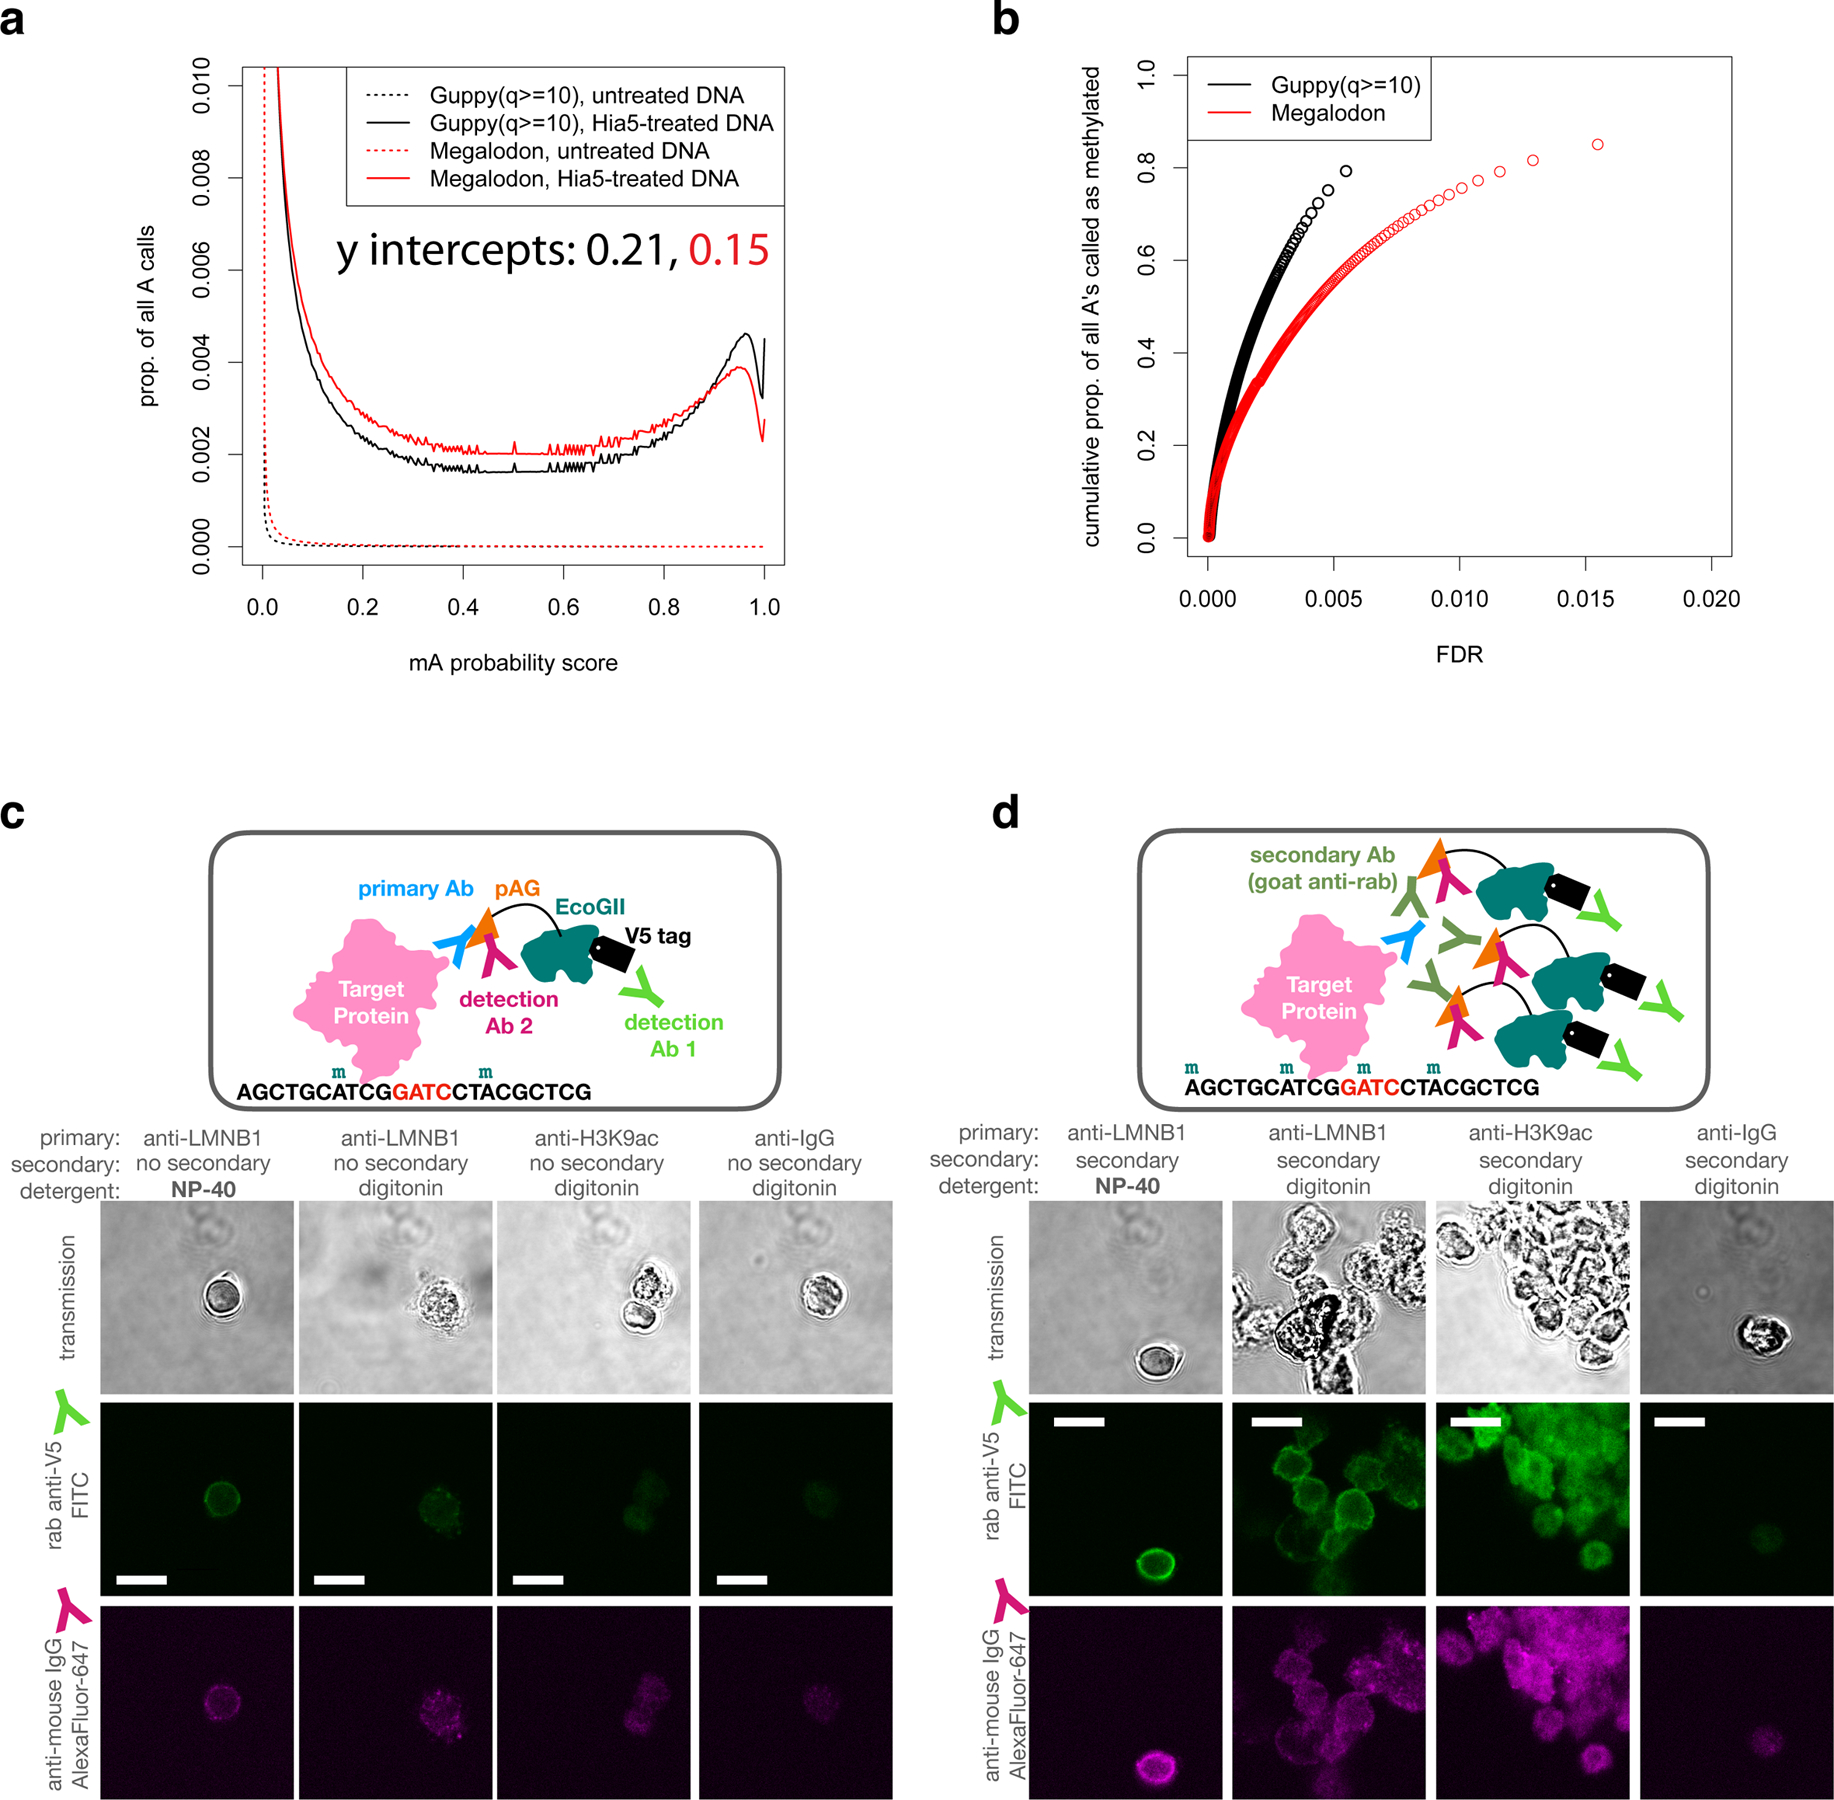
Extended Data Fig. 3. Assessment of mA calling and LMNB1 targeting.

a, The proportion of all adenines called as methylated at each possible probability mA probability score using two different software packages on ONT reads from two GM12878 DNA samples: untreated genomic DNA and purified genomic DNA methylated by Hia5 in vitro. The untreated DNA provides a measure of the false positive rate (FPR) at each score, since it contains few or no methyl adenines. The Hia-5 treated DNA provides a lower bound on the true positive rate (TPR) at each threshold. b, Estimates of the proportion of As methylated in the Hia5-treated DNA sample at each false discovery rate (FDR) threshold (FDR=FPR/(TPR+FPR), determined from a). At least 80% of the adenines on the Hia5-treated DNA appear to be methylated. c-d, In the DiMeLo-seq workflow, following the primary antibody and pA/G-MTase binding and wash steps, a sample of nuclei can be taken for quality assessment by immunofluorescence. One can determine the locations and relative quantity of pA/G-MTase molecules using fluorophore-conjugated antibodies that bind to the pA/G-MTase but not to the primary antibody. In these representative images, the results for pAG-EcoGII are shown, comparing different antibodies, detergents, and samples with (d) and without (c) the use of an unconjugated secondary antibody to recruit more pA/G-MTase molecules to the target protein. Scale bars representing 10 microns are shown in the FITC channel images as white lines.
