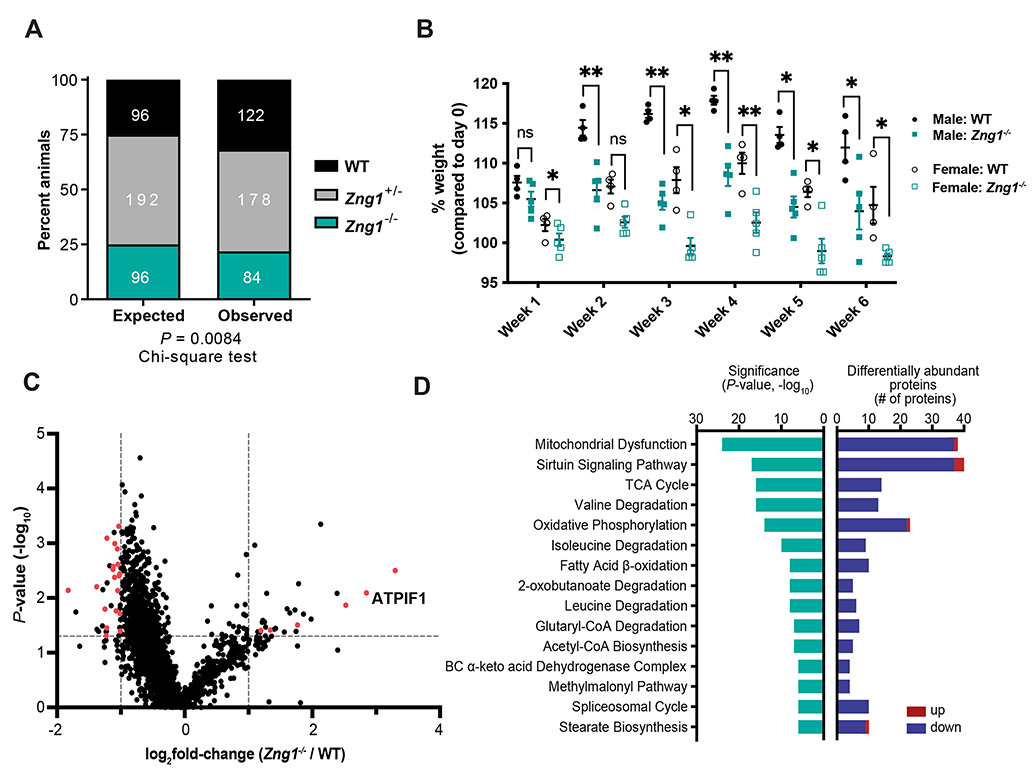
Figure 6. Zng1 mutant mice exhibit signatures of mitochondrial dysfunction on a Zn deficient diet.
(A) Genotype distribution of WT, Zng1+/−, and Zng1−/− mice. Number of animals per genotype indicated in white text. (B) Percent weight gain of 5-7 week old WT and Zng1 mutant mice that were placed on a Zn-deficient diet for 6 weeks (n= 4-5 mice / genotype / sex). (C) Differential protein abundances from dissected kidneys of 11-13 week old female WT and Zng1 mutant mice that were maintained on a low Zn diet for 5 weeks. Proteins that putatively localize to the mitochondria are highlighted in red (n = 5 mice / genotype). (D) IPA analysis of differentially abundant proteins (Zng1−/−/WT) with significance of gene enrichment and number of differentially abundant proteins for each pathway depicted. z-scores are denoted within teal bars and indicate the predicted effects on each pathway (positive values: activation; negative values: inhibition, n.a.: no prediction through IPA available due to insufficient evidence in the Knowledge Base). Red bars indicate enriched proteins in Zng1 mutant animals and blue bars represent proteins with reduced abundance. Data in panel A analyzed by Chi-squared goodness of fit test. Data in panel B analyzed by two-way ANOVA with Sidak’s multiple comparison test within each sex. See also Figure S6 and Table S3.

