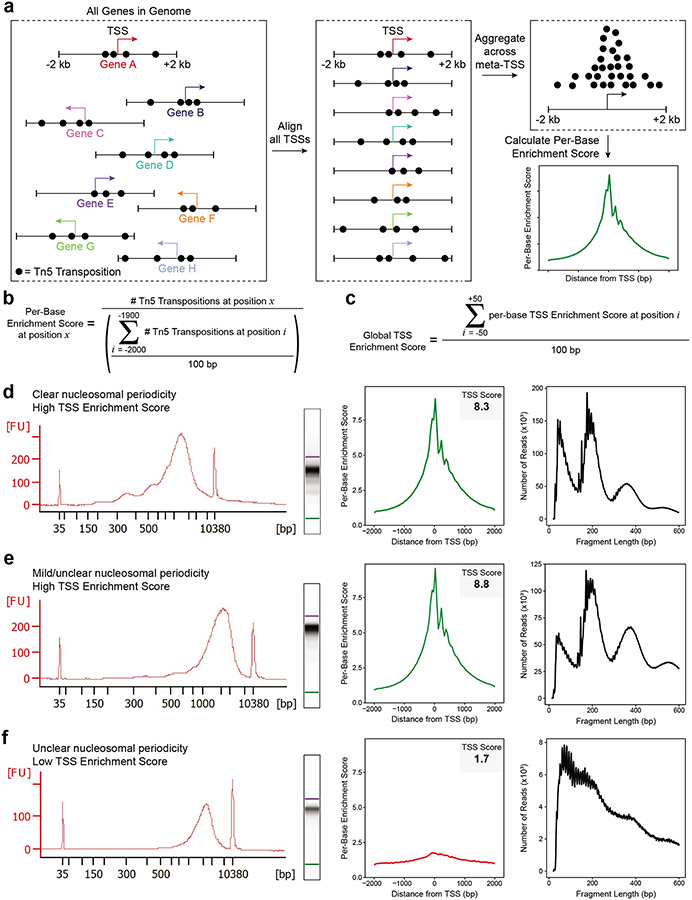
Figure 3: Assessing ATAC-seq library quality.
a. A schematic showing transposition events at a set of genes. The transcriptional start site (TSS) is depicted as an arrow with the direction of the arrow indicating whether the gene is present on the plus or minus strand. Each transposition event is shown as a black circle. Each gene has been clipped to include the region +/− 2 kb from the annotated TSS, and this region will be used in the calculation of the TSS Enrichment Score. Next, the TSS location and direction for every gene in the genome are aligned and the reads are aggregated across all of these sites into a ‘meta-TSS’. This then allows for the calculation of a per-base enrichment score via the equation in (b), which can be plotted along the +/− 2 kb of the meta-TSS, as shown in the TSS Enrichment Score graph in the bottom right. b. The equation, implemented by the PEPATAC pipeline, for calculating the per-base enrichment score. c. The equation, implemented by the PEPTATAC pipeline, for calculating the global TSS Enrichment Score for the whole library. d-f. From left to right: Bioanalyzer electropherogram trace and digitally rendered gel (left), TSS enrichment plot (middle), and fragment size distribution (right). Shown for (d) a successful ATAC-seq library with a high TSS Enrichment Score (8.3) and clear nucleosomal periodicity in the Bioanalyzer trace, (e) a successful ATAC-seq library with a high TSS Enrichment Score (8.8) but minimal observed nucleosomal periodicity in the Bioanalyzer trace, and (f) an unsuccessful ATAC-seq library with a low TSS Enrichment Score (1.7) and no clear nucleosomal periodicity in the Bioanalyzer trace. Note that all three libraries (d-f) have abundant high molecular weight fragments (>2000 bp) on the Bioanalyzer trace (left) but these fragments do not cluster on the sequencer and thus are not represented in the fragment size distributions derived from the corresponding sequencing data (right). In (e), despite not being easily observed on the Bioanalyzer trace, the characteristic fragment size distribution is observed using low-depth sequencing. In (f), the TSS Enrichment Score and fragment size distribution plots on the right indicate a poor signal-to-background ratio and low sample quality, respectively, marking this library a poor candidate for high-depth sequencing.

