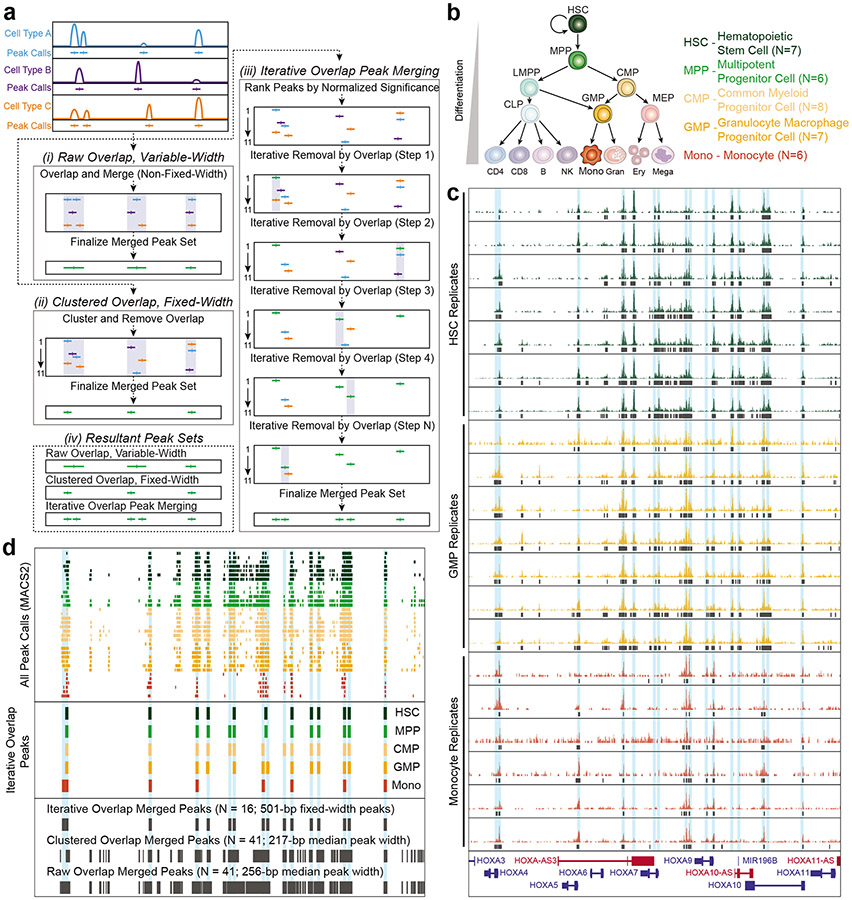
Figure 5: Schematic of peak merging strategies and the resulting merged peak sets.
a. Schematic of the three possible peak merging options that have been frequently used for ATAC-seq data: raw overlap with variable-width peaks, clustered overlap with fixed-width peaks, and iterative overlap with fixed-width peaks. This panel has been directly reproduced from Granja & Corces et al. 2021132. (i) In the raw overlap with variable-width peaks approach, any peaks that overlap with each other are merged together into a single, larger peak. This type of peak merging approach is implemented using the bedtools merge command, and will result in peaks that are of variable widths and often span multiple distinct regulatory elements. In this example, the raw overlap approach results in 41 peaks with a median peak width of 256 base pairs (bp) (+/− 408-bp standard deviation). (ii) In the clustered overlap with fixed-width peaks approach, clustered peaks are taken together and a single winner is chosen among them. This is typically implemented using the bedtools cluster command. The resulting merged peak set contains fixed-width peaks and has a tendency to under-represent regulatory elements that are located in close proximity. In this example, the clustered overlap approach results in 41 peaks with a median peak width of 217 bp (+/− 326-bp standard deviation). (iii) In the iterative overlap with fixed-width peaks approach, first introduced in Corces & Granja et al. 201838, fixed-width peaks are first ranked by their normalized significance. Once ranked, the most significant peak is retained, and any peaks directly overlapping with that peak are removed. This ranking and removal are iterated until there are no more overlapping peaks. The resulting merged peak set contains fixed-width peaks. In this example, the iterative overlap approach results in 16 peaks with a fixed peak width of 501 bp (0-bp standard deviation). (iv) Comparison of the resulting merged peak sets made using methods i-iii. b. Diagram of the hematopoietic differentiation hierarchy; to the right is number of samples used in panels (c) and (d) for each cell type. c. ATAC-seq signal tracks of the data from three distinct hematopoietic cell types from Corces & Buenrostro et al. 201637. MPP and CMP data were excluded to improve figure legibility. Each track represents a different human donor. MACS2 peak calls are shown as black boxes below each signal track. (d) Comparison of the MACS2 peak calls and the peak merging approaches for the tracks shown in (c). (top) All MACS2 peak calls from (c) colored by their respective cell type. (middle) The cell type-specific peak sets derived from the first round of the iterative overlap approach are shown after merging peaks from each of the biological replicates. (bottom) Final merged peak set for all biological replicates across all cell types using the three methods described in (a). The number of resulting peaks, and their summary statistics, are shown.

