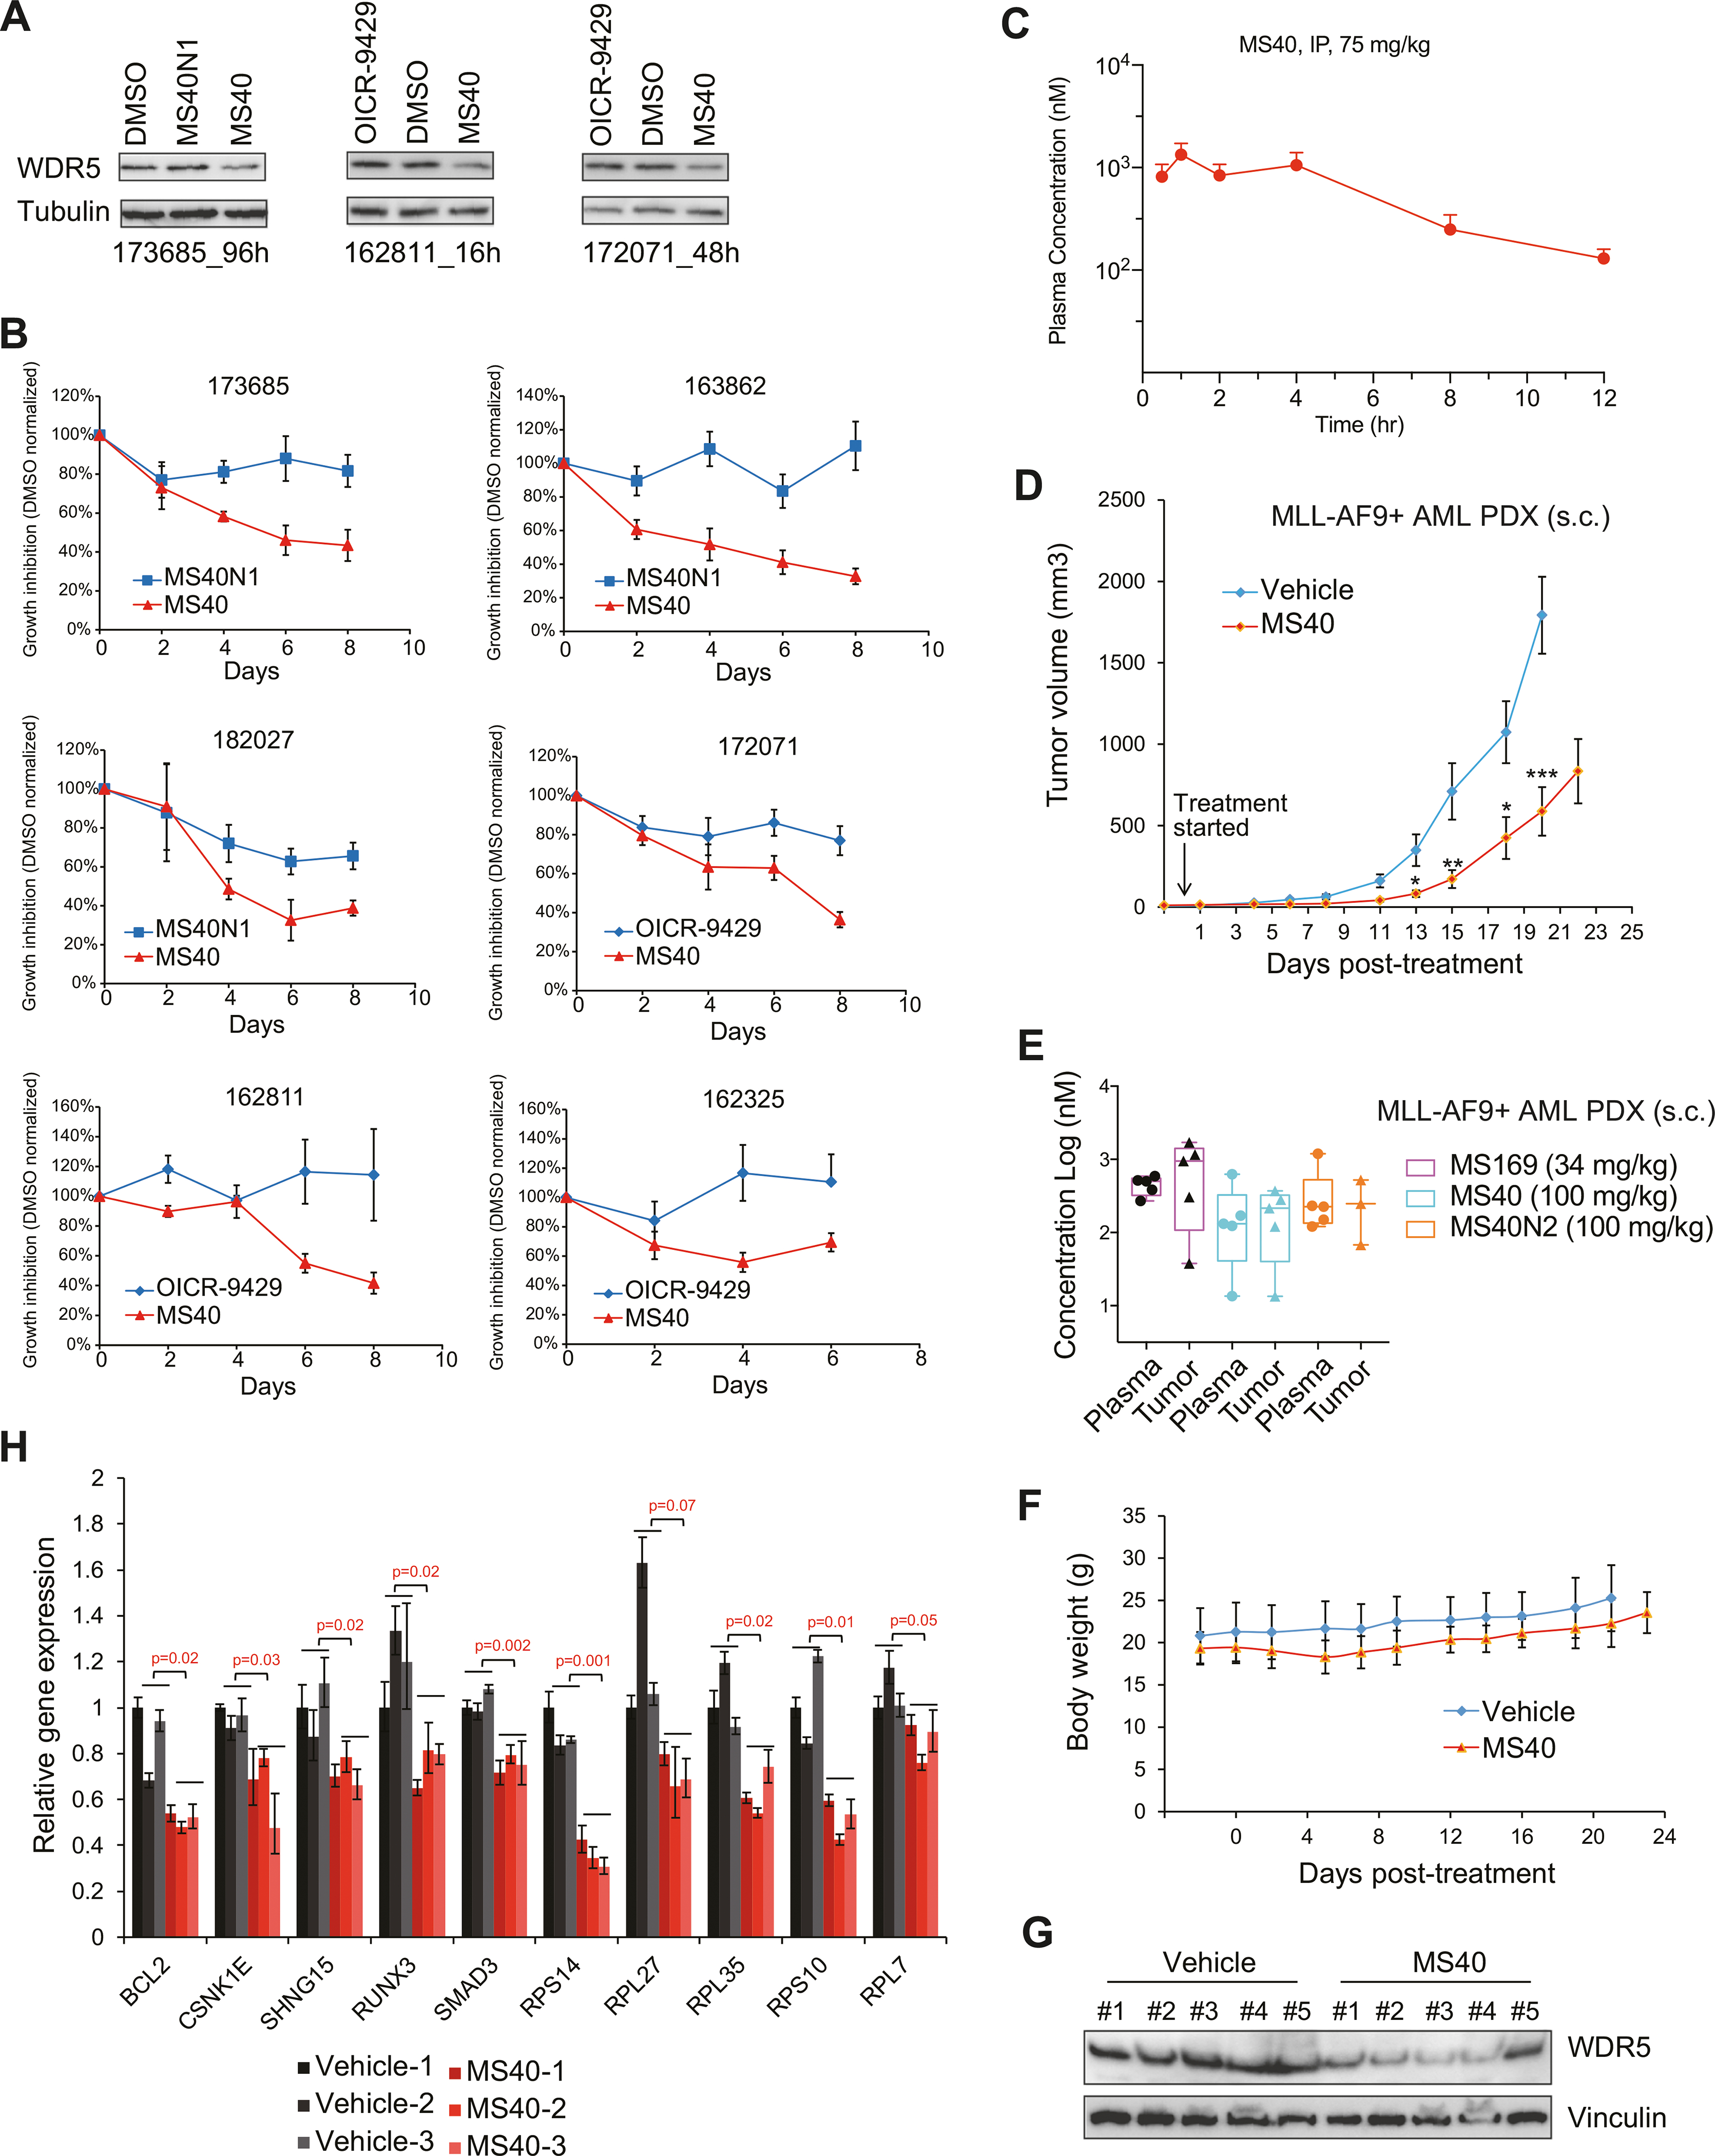
Fig. 7. MS40 inhibits the growth of primary AML patient cells in vitro and AML PDX in vivo.

A Immunoblotting for WDR5 and tubulin in three patient-derived primary AML cells after treatment respectively for 96 h (172152, left), 16 h (162811, middle) and 48 h (172071, right) with DMSO or 5 μM of MS40, MS40N1 or OICR-9429. B Growth inhibition (y-axis) after the indicated duration (x-axis) of treatment with 5 μM of MS40, MS40N1 or OICR-9429, compared to DMSO, in six primary AML patient samples cultured in vitro. Y-axis, presented in the mean ± SE, shows the proliferation of compound-treated cells after normalization to DMSO-treated (n = 3 independent experiments). C Intra-plasma concentration of MS40 over a 12-hour period in Swiss Albino mice following a single 75 mg/kg intraperitoneal (i.p.) injection of MS40 (n = 3 mice per time point; mean ± SE). D In vivo growth of the MLL-AF9 + AML PDX tumors subcutaneously (s.c.) xenografted into the NSG-SGM3 mice, followed by treatment from the indicated starting time-point with either vehicle (n = 10 tumors) or 100 mg/kg of MS40 (n = 10; i.p. once a day for five days per week). Y-axis shows the tumor volumes and are presented in mean ± SE. *P < 0.05; **P < 0.01; ***, P < 0.001. E Compound concentrations in the plasma (left) and tumor samples (right) isolated from five NSG-SGM3 mice xenografted with the MLL-AF9 + AML PDX. Samples were collected at two hours post the last dose from the mice treated with MS40 (100 mg/kg), MS169 (34 mg/kg) or MS40N2 (100 mg/kg). F Body weight of NSG-SGM3 mice bearing the MLL-AF9 + AML PDX, treated with either vehicle (n = 5 mice) or 100 mg/kg of MS40 (n = 5, i.p. SID) for 5 days per week. G–H Immunoblotting for WDR5 and vinculin G and RT-qPCR for the indicated WDR5:MLL target genes H in the MLL-AF9 + AML PDX tumor samples isolated at two hours post the last dose from the NSG-SGM3 mice treated with vehicle or MS40. RT-qPCR signals, presented as the mean ± S.D., were normalized first to those of GAPDH and then to DMSO-treated cells (n = 3 replicated experiments).
