Figure S5.
Microglia single-cell RNA sequencing quality controls, related to Figure 3
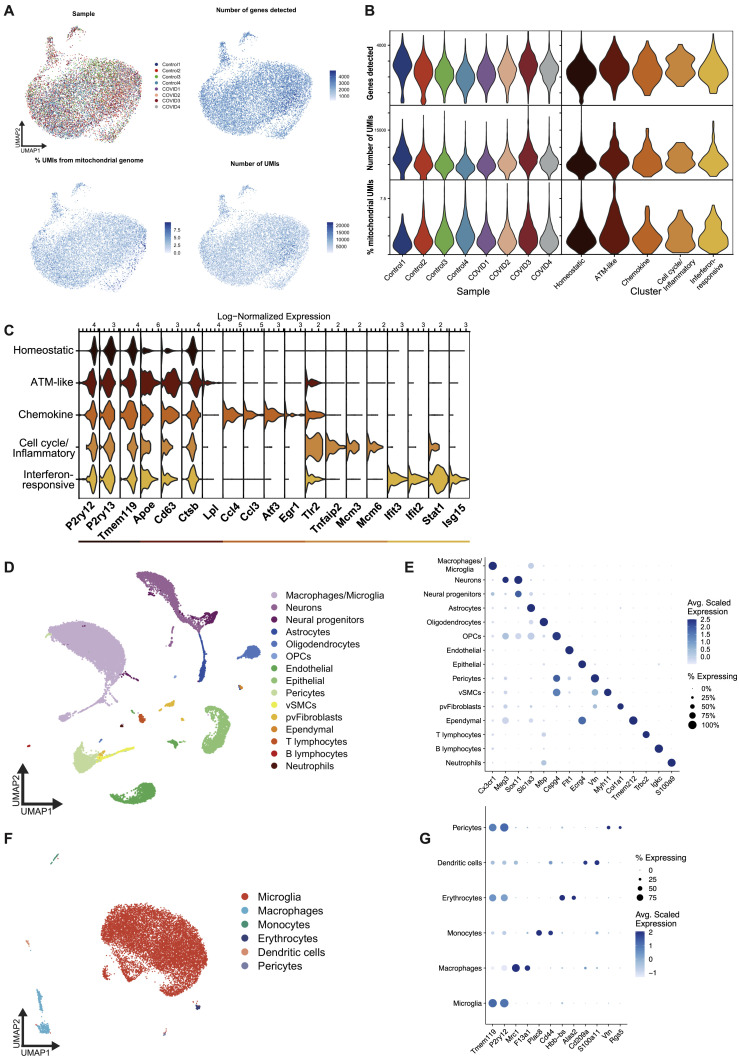
(A) UMAP plots overlaid with sample metadata and common quality control metrics.
(B) Violin plots of common quality control metrics across samples and microglia clusters.
(C) Violin plots of log-normalized expression of top marker genes for each microglia cluster.
(D) UMAP plot depicting first round of clustering and cell type annotation, used to identify microglia for downstream analysis. Cell types were annotated based on marker gene expression, some of which is shown in (E).
(E) Dot plot showing the average scaled expression of cell type markers across the original clusters, demonstrating the validity of the cell type labels. The size of each dot corresponds to the proportion of cells in the indicated group which express the gene.
(F) UMAP showing subclustered cells from the macrophages/microglia cluster depicted in (D) and (E), with newly updated cell type labels. This second round of clustering was performed to remove contaminating cells of other types before a third round of clustering to identify microglia states.
(G) Dot plot showing expression of cell type marker genes used in the annotation of the clusters shown in (F). Note that while some non-microglial clusters appear to express the microglia-specific markers Tmem119 and P2ry12, this is driven by a small number of outlier microglia which clustered with these non-microglial cell types. The final microglia cluster does not express canonical markers of these other cell types, indicating that the cluster is highly pure. Analysis of this group of cells is what appears in Figure 3.

