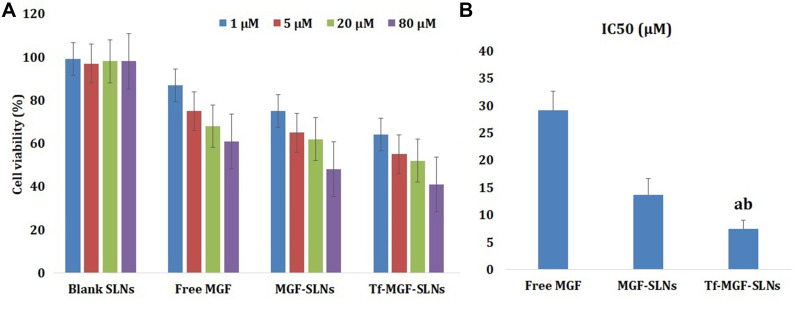
Figure 5.
In vitro viability of different MGF formulations in A549 cells. Data represent mean ± SD (n = 3). (A) Cell viability cultured with blank SLNs, free MGF, MGF-SLNs and Tf-MGF-SLNs loaded at various concentrations of MGF after 24 h. (B) The IC50 values of free MGF, MGF-SLNs and Tf-MGF-SLNs-treated A549 cells. (ap <0.05, Tf-MGF-SLNs vs Blank SLNs, bp <0.05, Tf-MGF-SLNs vs free MGF, cp <0.05, Tf-MGF-SLNs vs MGF-SLNs).

