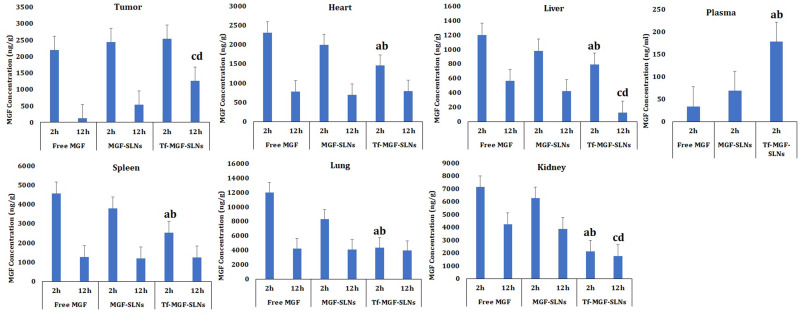
Figure 8.
The concentrations of MGF in tumor, heart, liver, spleen, lungs, kidneys and plasma of A549 tumor-bearing mice 2 or 12 h after iv injection of either free MGF, MGF-SLNs or Tf-MGF-SLNs. The dose of MGF was 10 mg/kg. Data shown are mean ± SEM (n=10). (ap <0.05, Tf-MGF-SLNs vs free MGF (2h), bp <0.05, Tf-MGF-SLNs vs MGF-SLNs (2h), cp <0.05, Tf-MGF-SLNs vs free MGF (12h), dp <0.05, Tf-MGF-SLNs vs MGF-SLNs (12h).

