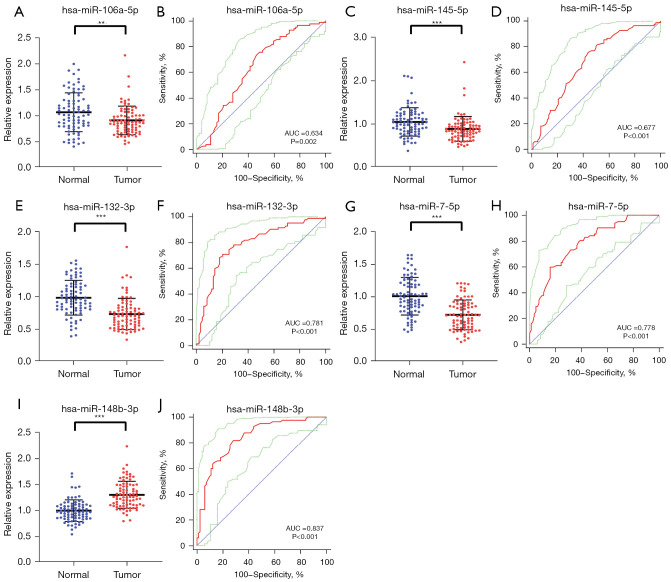
Figure 3.
The relative expression levels and ROC curve analyses of five candidate miRNAs in validation stage. The red curve represents ROC curve; the green curve represents 95% ROC confidence interval; the blue line represents diagonal. **, P<0.01; ***, P<0.001. The relative expression level of (A) miR-106a-5p, (C) miR-145-5p, (E) miR-132-3p, (G) miR-7-5p, (I) miR-148b-3p in serum between healthy controls and bladder cancer patients. ROC curve analyses of (B) miR-106a-5p, (D) miR-145-5p, (F) miR-132-3p, (H) miR-7-5p, (J) miR-148b-3p. ROC, receiver operating characteristic.

