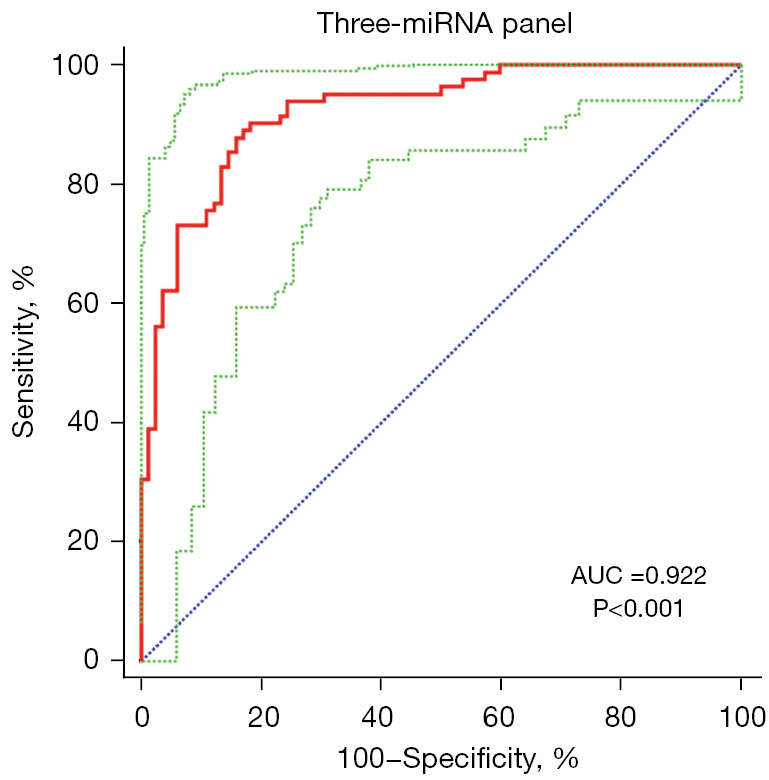
Figure 4.

The ROC curve analyses for the three-miRNA panel. AUC =0.922 (95% CI: 0.870 to 0.958; sensitivity =90.24%, specificity =81.71%). The red curve represents ROC curve; the green curve represents 95% ROC confidence interval; the blue line represents diagonal. miRNA, microRNA; ROC, receiver operating characteristic; AUC, area under the ROC curve.
