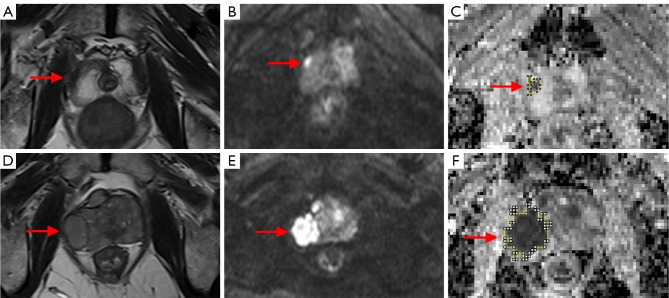
Figure 1.
MRI images of PCa and BPH. (A-C) MRI images of BPH patients; (D-F) MRI images of PCa patients. (A,D) focal, well-defined, low-signal lesions in the right peripheral area on T2WI (red arrow); (B,E) significant high signal on DWI (red arrow); (C,F) significant low signal on the ADC chart (shown as irregular yellow area). MRI, magnetic resonance imaging; PCa, prostate cancer; BPH, benign prostate hyperplasia; T2WI, T2-weighted image; DWI, diffusion-weighted imaging; ADC, apparent diffusion coefficient.

