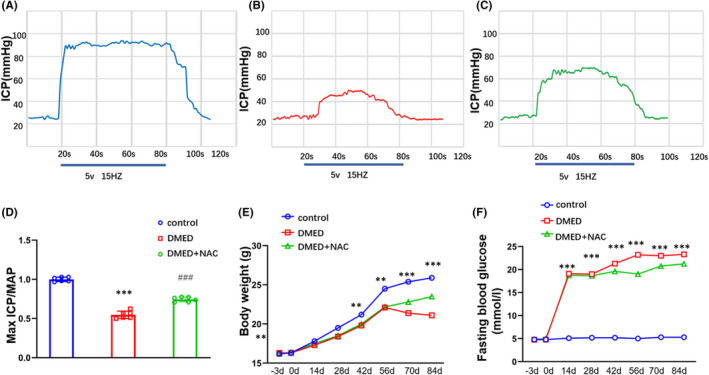
FIGURE 1.

Comparisons of blood glucose levels and body weights between DMED and controls after STZ injection. (A) Representative traces of ICP in control mice (B) Representative traces of ICP in DMED mice. (C) Representative traces of ICP in DMED + NAC mice. (D) Maximal ICP/MAP ratios. (E) Body weights. (F) Blood glucose levels. The data are presented as means ± SDs. N = 6 per group. *p < 0.05 compared with control group. # p < 0.05 compared with DMED group. DMED, diabetes mellitus‐induced erectile dysfunction; ICP, intracavernous pressure; MAP, mean systemic arterial pressure; NAC, N‐acetylcysteine
