
FIGURE 3.
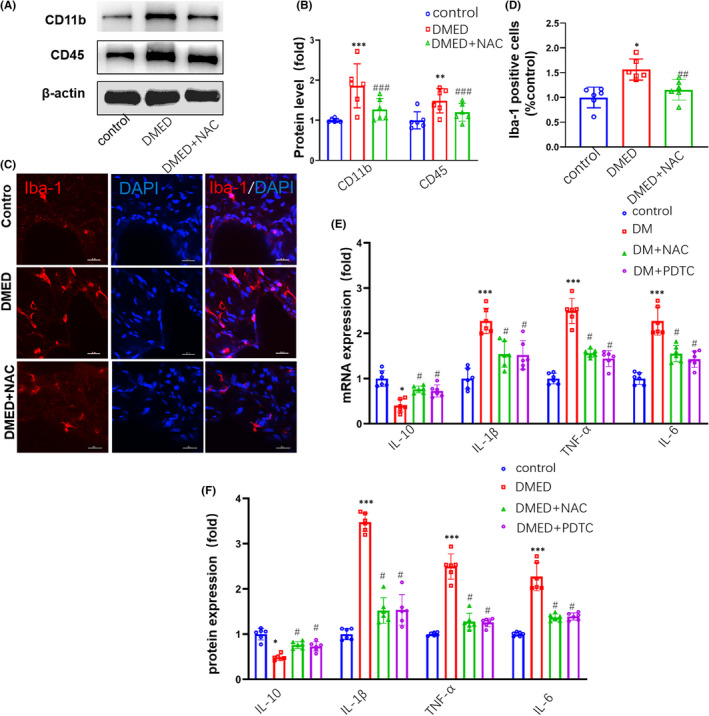
Comparisons of inflammatory cytokine expressions in the corpus cavernosum among control, DMED and DMED + NAC mice. (A) Representative Western blot for CD45 and CD11b. (B) Western blot analysis of CD45 and CD11b protein expressions. (C) Immunofluorescent signals of Iba‐1‐positive microglial cells. Scale bar is 20 μm. (D) Quantitative analysis of relative intensities of Iba‐1‐positive cells. (E) qPCR assay results for mRNA expression levels of IL‐10, IL‐1β, TNF‐α and IL‐6. (F) ELISA analysis results for protein levels of IL‐10, IL‐1β, TNF‐α and IL‐6. PDTC: pyrrolidine dithiocarbamate. N =6 per group. *p < 0.05, **p < 0.01 and ***p < 0.001, compared to the control group. # p < 0.05, ## p < 0.01 and ### p < 0.001, compared to the DMED group