
FIGURE 4.
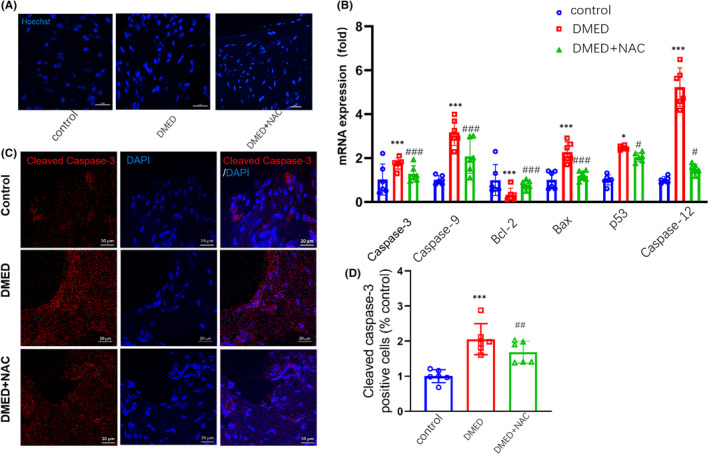
Comparisons of apoptosis in the corpus cavernosum among control, DMED and NAC‐treated mice. (A) Representative images of Hoechst‐33258 staining for observation of morphological changes in nuclei of DMED mice showing increases in apoptotic nuclei. Scale bar is 20 μm. (B) qPCR assay results for mRNA expression levels of Bcl2, Bax, caspase 3, p53, caspase 9 and caspase 12. (C) Immunofluorescent signals of cleaved caspase 3‐positive cells. Scale bar is 20 μm. (D) Quantitative analysis of relative intensities of cleaved caspase 3‐positive cells. N = 6 per group. ***p < 0.001, compared to the control group. ## p < 0.01 and ### p < 0.001, compared to the DMED group