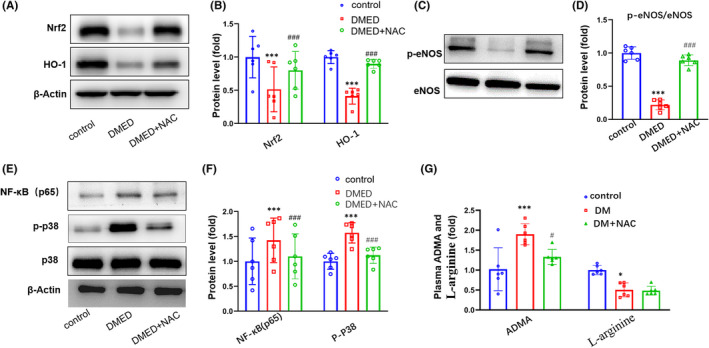
FIGURE 5.

Comparisons of Nrf2, HO‐1, P38 and NF‐κB (p65) protein levels in the corpus cavernosum among control, DMED and NAC‐treated mice. (A) Representative Western blot of Nrf2 and HO‐1. (B) Western blot analysis of Nrf2 and HO‐1 protein expressions. (C) Representative Western blot of eNOS and p‐eNOS. (D) Western blot analysis of eNOS and p‐eNOS protein expressions. (E) Representative Western blot of NF‐κB(p65) and p‐P38. (F) Western blot analysis of NF‐κB(p65) and p‐P38 protein expressions. (G) Representative plasma ADMA and L‐Arginine levels. ADMA, asymmetric dimethylarginine. N = 6 per group. ***p < 0.001, compared to the control group. ### p < 0.001, compared to the DMED group. * p < 0.05, compared to the control group. # p < 0.05, compared to the DMED group
