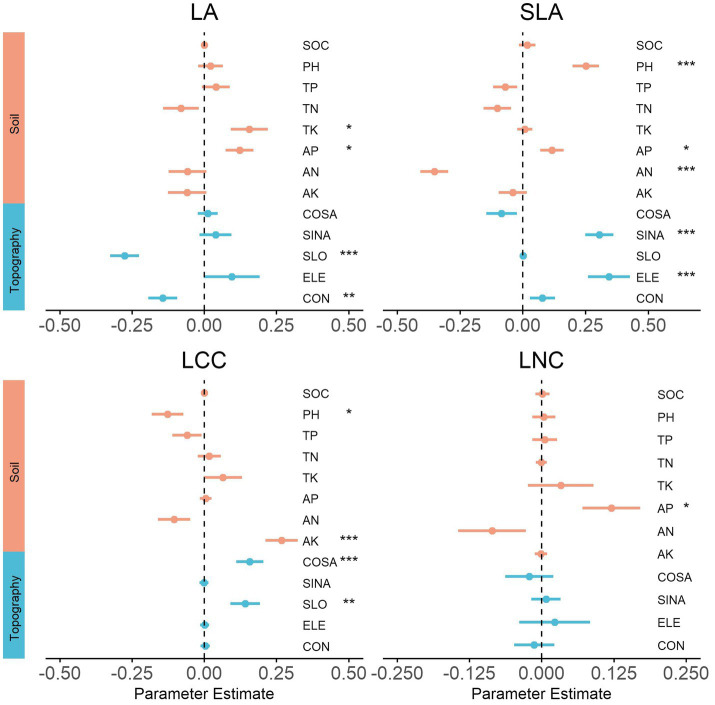
Figure 4.
Effects of environmental variables on community functional composition for the local scale. We show the averaged parameter estimates (standardized regression coefficients) of model predictors and the associated 95% confidence intervals. The p-value of each predictor are given as: (.), p < 0.1; *p < 0.05; **p > 0.01; ***p < 0.001. SOC, organic carbon mass content; PH, soil acidity; TP, total phosphorus; TN, total nitrogen; TK, total potassium; AP, available phosphorus; AN, available nitrogen; AK, available potassium; COSA, North aspect; SINA, East aspect; SLO, slope; ELE, elevation; CON, convexity.

