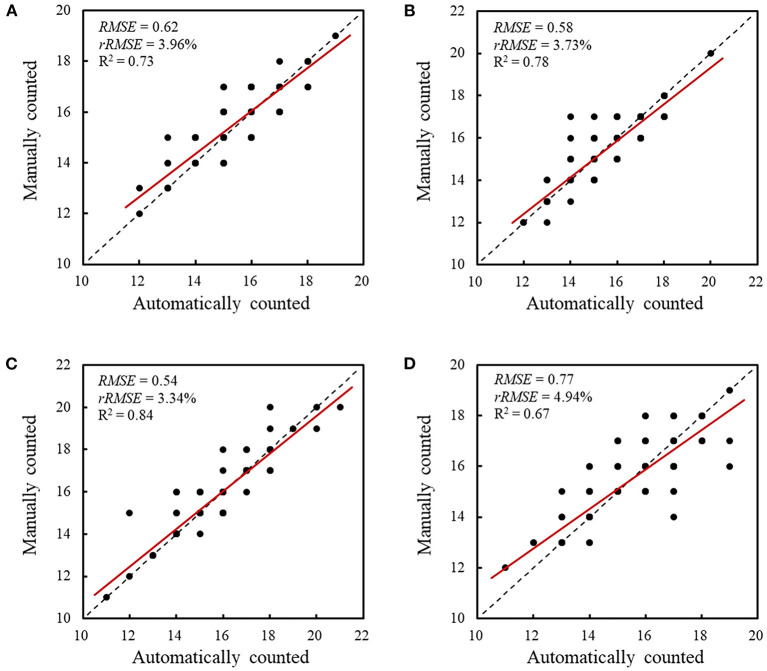
Figure 9.
Comparison between the automatically and manually counted spikelet results. (A) Comparison and correlation for Shiyou 20, (B) comparison and correlation for Shannong 25, (C) comparison and correlation for Liangxing 99, and (D) comparison and correlation for Shenmai 818. The red lines indicate the least squares linear regression lines. The dashed lines are 1:1 lines.

