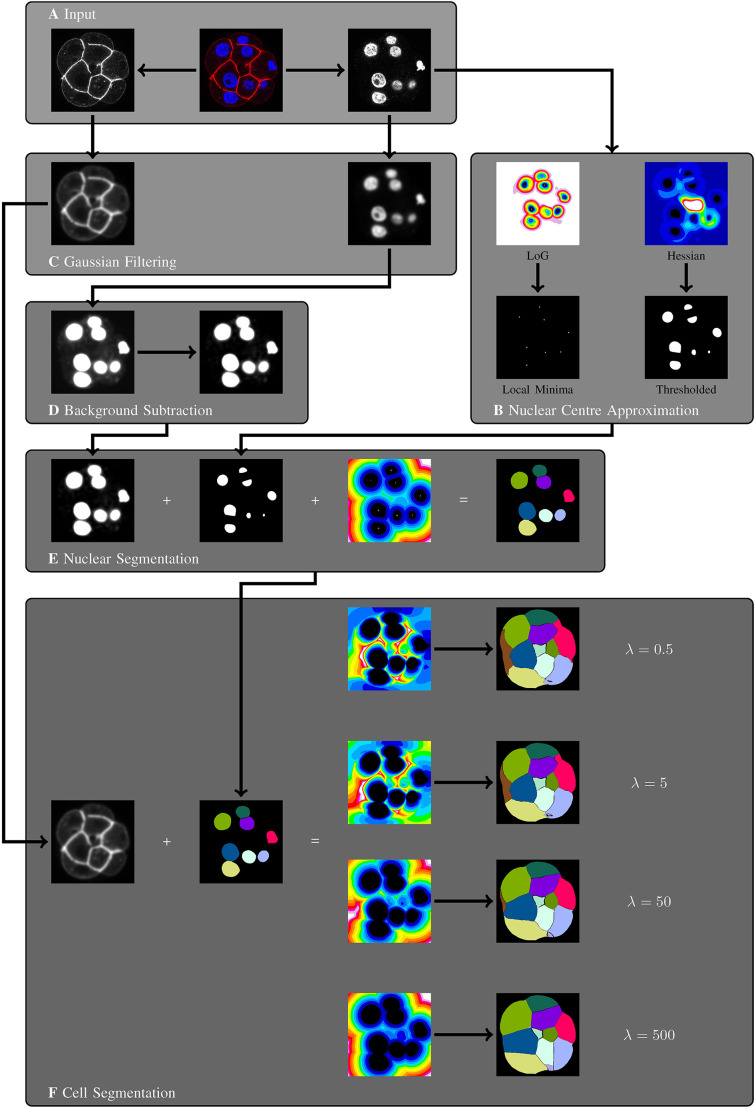
Fig. 2.
Overview of the algorithms underpinning GIANI. All images represent a single slice of a 3D stack and are for illustrative purposes only. (A) An example dataset, consisting of a mouse embryo showing DAPI (blue) and E-cadherin (red). GIANI can accept as input any image data that is readable by Bio-Formats (Linkert et al., 2010). (B) Nuclear centres are first approximated using one of two blob detectors – Laplacian of Gaussian (left) or Hessian (right). (C) Gaussian filtering is used to suppress noise in the channels used for nuclear and cell segmentation. (D) The nuclear channel is then subjected to top-hat filtering to remove background; contrast has been increased to illustrate the effect of the filter. (E) Nuclear segmentation is achieved using a marker-controlled watershed approach, with the background-subtracted image from D serving as the input and approximated centres from B serving as the seeds. (F) Cell segmentation is achieved using the same marker-controlled watershed approach, with the filtered image from C serving as the input and nuclei segmentations from E serving as the seeds.

