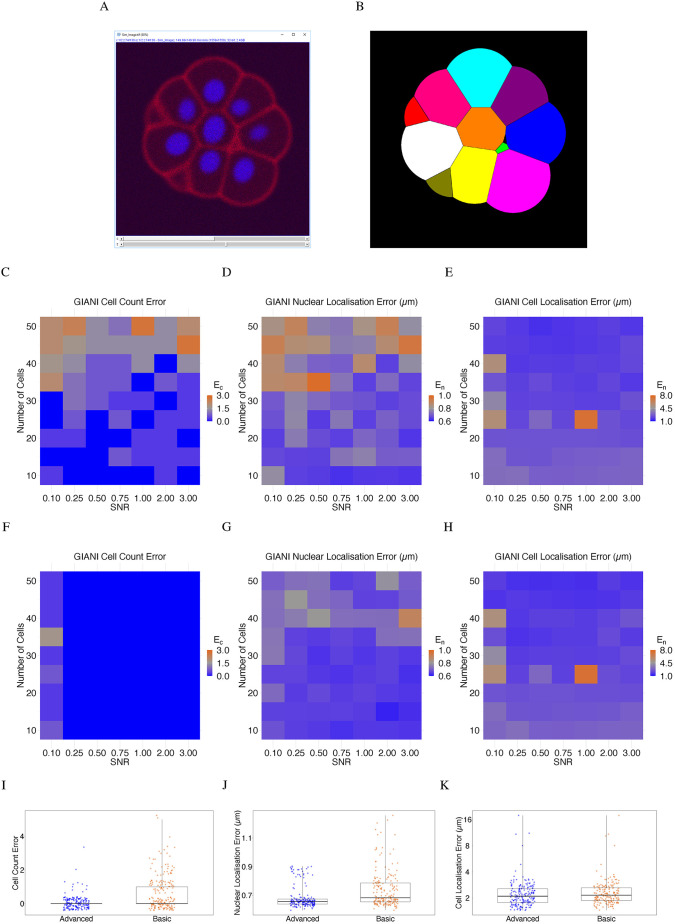
Fig. 3.
Validation of GIANI using simulated embryo data. In each of the heat maps, a single tile represents the average of three simulated embryos. The GIANI settings used to produce this data are available to download from https://doi.org/10.5281/zenodo.6205979. (A) A 2D slice of an exemplar 3D simulated embryo. (B) The ground truth segmentation of ‘A’. (C–H) Absolute errors in cell counts (Ec, calculated according to Eqn 3), nuclear centroid localisation error (Enl) and cell centroid localisation error (Ecl) produced by GIANI for simulated embryos with the indicated number of cells and signal-to-noise ratios (SNRs). Results were obtained using either GIANI's basic (C–E) or advanced (F–H) nuclear detector. (I–K) Comparison of the overall distribution of errors in cell counts, nuclear centroid localisation and cell centroid localisation for GIANI's basic and advanced nuclear detectors, across all SNRs and cell numbers. Each dot represents a single simulated embryo. Box plots show the median (line) and IQR, with the whiskers extending 1.5 times the IQR from the 25th and 75th percentiles

