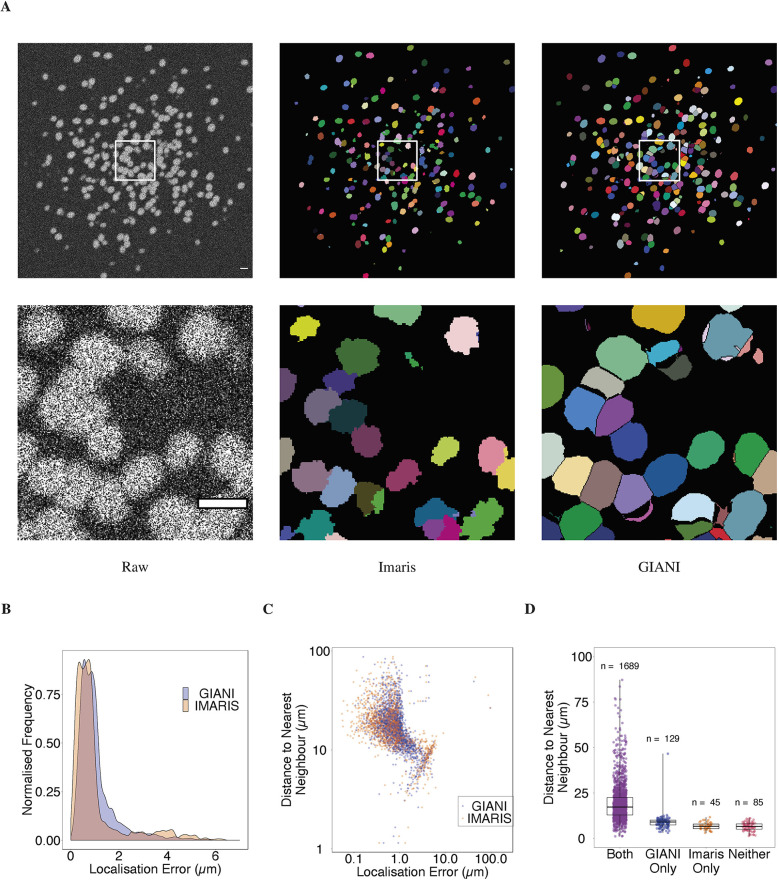
Fig. 5.
Demonstration of GIANI with a large simulated dataset. The GIANI and Imaris settings used to produce this data are available to download from https://doi.org/10.5281/zenodo.6206022. (A) Illustration of the segmentations produced by GIANI and Imaris on a large simulated dataset (available to download from https://doi.org/10.5281/zenodo.5270244). The top row shows a single slice of each 3D volume, whereas the bottom row shows the magnified views of the boxes in the top row images. Scale bars: 20 μm. (B) Distribution of localisation errors produced by both Imaris and GIANI in detecting the simulated nuclei. (C) Relationship between localisation error for detected nuclei and the distance of each nucleus to its nearest neighbour. (D) Influence of distance of nuclei to their nearest neighbour on successful detection. Box plots show the median (line) and IQR, with the whiskers extending 1.5 times the IQR from the 25th and 75th percentiles.

