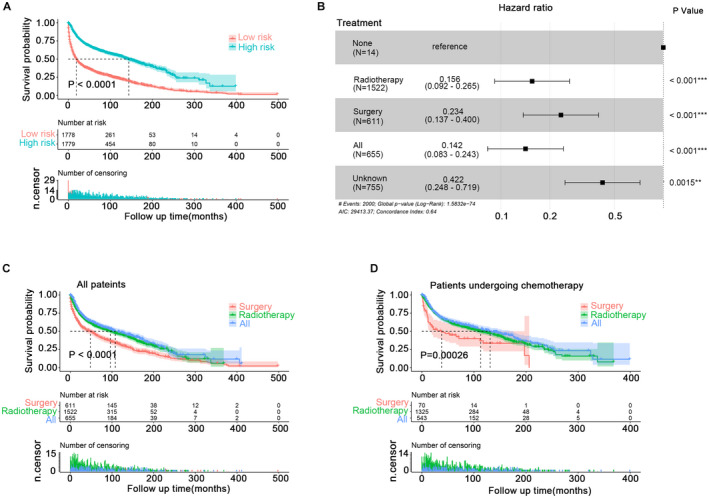
FIGURE 3.

KM analysis of CSCC patients. (A) TheKM analysis of high‐risk and low‐risk populations from (C). (B) Univariate cox regression analysis of treatment. (C) The KM survival analysis of patients in groups radiotherapy, surgery, and radiotherapy combined with surgery. (D) The KM survival analysis of patients (undergoing chemotherapy) in groups radiotherapy, surgery, and radiotherapy combined with surgery. CSCC, colorectal squamous cell carcinoma; KM, Kaplan–Meier
