FIGURE 4.

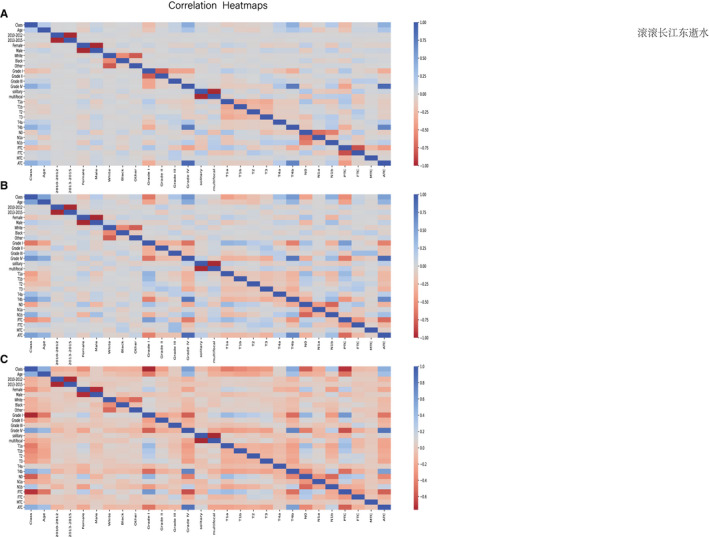
Correlation heatmaps of patients' characteristics features in original data (A), under‐sampling data (B), and over‐sampling (C)

Correlation heatmaps of patients' characteristics features in original data (A), under‐sampling data (B), and over‐sampling (C)