
FIGURE 4.
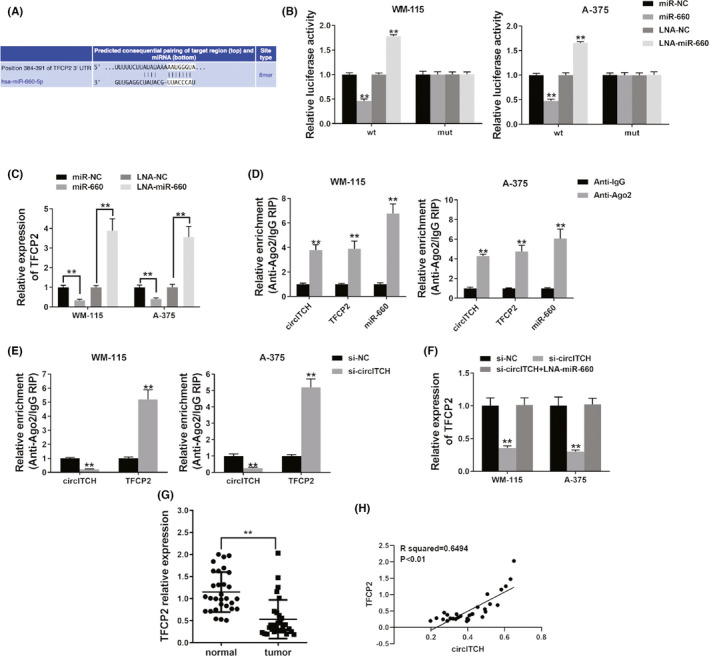
circITCH functions as ceRNA TFCP2 regulator. (A) The projected binding miR‐660 site in the 3’UTR of TFCP2. (B) Luciferase assay was performed. (C) qRT‐PCR detected TFCP2 expression after cell transfection. (D) RIP assay showed the level of circITCH, TFCP2, and miR‐660 enrichment for Ago2. (E) RIP assay on Ago2 was done after cell transfection. (F) qRT‐PCR detected TFCP2 expression after cell transfection. (G) The TFCP2 expression in 30 pairs of melanoma tissues and adjacent normal tissues. (H) Pearson correlation examination of TFCP2 and circITCH for the 30 melanoma tissues. **p < 0.01