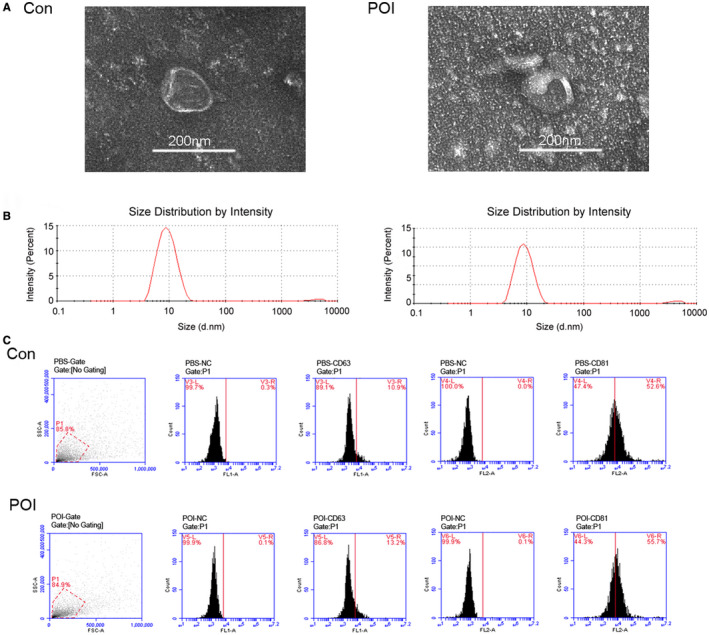
FIGURE 2.

Isolation and characterization of ovarian exosomes. (A) Electron microscopy image of exosomes isolated from ovarian tissues of the control group and POI groups. Scale bar: 200 nm. (B) Detection of exosome particle size in each group. (C) FACS analysis of exosome surface marker protein. They were positive for CD63 and CD81
